Flow Meter Laboratory Report Introduction This report will investigate
advertisement
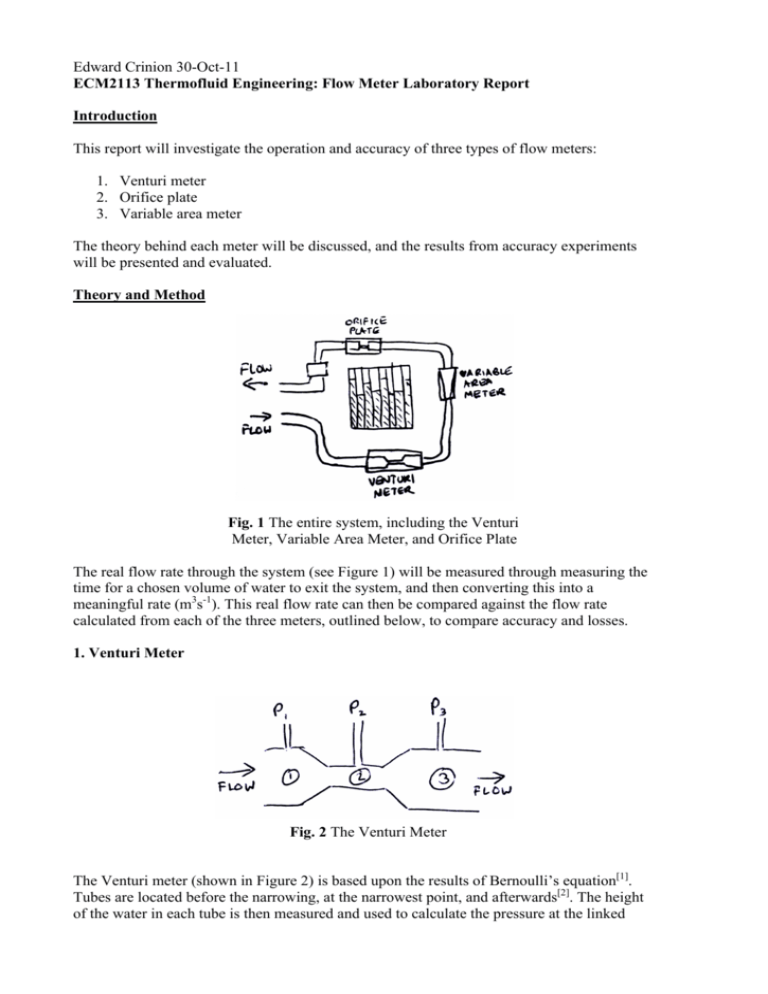
Edward Crinion 30-Oct-11 ECM2113 Thermofluid Engineering: Flow Meter Laboratory Report Introduction This report will investigate the operation and accuracy of three types of flow meters: 1. Venturi meter 2. Orifice plate 3. Variable area meter The theory behind each meter will be discussed, and the results from accuracy experiments will be presented and evaluated. Theory and Method Fig. 1 The entire system, including the Venturi Meter, Variable Area Meter, and Orifice Plate The real flow rate through the system (see Figure 1) will be measured through measuring the time for a chosen volume of water to exit the system, and then converting this into a meaningful rate (m3s-1). This real flow rate can then be compared against the flow rate calculated from each of the three meters, outlined below, to compare accuracy and losses. 1. Venturi Meter Fig. 2 The Venturi Meter The Venturi meter (shown in Figure 2) is based upon the results of Bernoulli’s equation[1]. Tubes are located before the narrowing, at the narrowest point, and afterwards[2]. The height of the water in each tube is then measured and used to calculate the pressure at the linked point in the meter, using the equation P=ρgh where P is pressure, ρ is density, g is the gravitational constant and h is the measured height. The flow rate can then be calculated using Bernoulli’s equation[3]: Where V is velocity, g is the gravitational constant, P is pressure, ρ is density and Z is the height (in this case the height difference is zero and irrelevant). Since flow rate is velocity multiplied by area (Q=VA), Bernoulli’s equation can be rearranged into an equation to calculate Q: Here A1=7.92x10⁻⁴m2 and A2=1.77x10⁻⁴m2, and the values for pressures P1 and P2 are calculated from the heights measured in the tables (see the Results section). 2. Variable Area Meter Fig. 3 The Variable Area Meter The Variable Area Meter consists of a weight in a tube of graduated area that balances the force of gravity with the force of the flow, resulting in an output height. (See Figure 3.) This “height” is effectively the flow rate[4]. 3. Orifice Plate Fig. 4 The Orifice Plate Meter[5] In a similar way to the Venturi Meter, the Orifice Plate (see Figure 4) measures volumetric flow by converting displaced water into pressure values at certain points and inputting these figures into a rearranged form of Bernoulli’s equation[6]. The volumetric flow rate will be measured (in all three meters) for three different flow rates: 5 litres/second, 12 litres/second, and 20 litres/second. Since the very nature of the investigation means there is no certain way of attaining this flow, these values will be recorded from the Variable Area Meter. (VAM in the tables below.) Potential Errors and Minimising their Effects There are four main errors that could affect the accuracy and validity of results. 1. Parallax Errors. This occurs if the level on a gauge is read from a non-normal angle, or more importantly an inconsistent angle. The degree of error varies depending on thickness of glass and size of scale, and this could effect the pressure calculations for all meters as well as the “real” flow calculations. This potential error can be tackled by ensuring all gauge readings are taken from 45°. 2. Surface Tension. When measuring the height of a water surface, it is possible for inconsistency to occur due to the curved nature of surface because of surface tension. The surface height in the tubes (at the centre of Figure 1) is used to calculate the pressure, making this a major potential error. To reduce error, readings are taken from the lowest possible surface point. 3. Human Reaction Times. The base volumetric flow is measured by timing the period to output a specified volume of water, but this rate could be inaccurate because of the variable quality of human reactions. There is no full-proof way to eliminate this error, though vigilance will be key. A large volume of water will also be used to ensure any error will be minimised. 4. Waves. The real volumetric flow is measured by timing the period to output a specified volume of water, but this rate could be inaccurate because of the wavy nature of the scale to measure water volume. A large volume of water will be used to minimise wave influence. Accuracy Results Table 1 shows the results from the first attempt at measuring flow rates and the associated pressures. The experiment was repeated (Table 2) and the average was taken for greatest accuracy (Table 3). Table 1 First results VAM Volume/m3 Time/s Q/m3s-1 5 12 20 0.010 0.024 0.040 120.22 140.72 129.69 8.32x10⁻⁵ 1.71x10⁻⁴ 3.08x10⁻⁴ 1 2 3 4 5 6 7 8 /mm /mm /mm /mm /mm /mm /mm /mm 274 314 370 258 243 196 265 285 330 263 275 297 210 215 228 210 218 230 201 171 107 205 187 149 Table 2 Second results VAM Volume/m3 Time/s Q/m3s-1 5 12 20 0.010 0.024 0.040 122.41 121.15 125.35 8.17x10⁻⁵ 1.65x10⁻⁴ 3.19x10⁻⁴ 1 2 3 4 5 6 7 8 /mm /mm /mm /mm /mm /mm /mm /mm 255 237 195 255 237 195 265 281 331 263 269 300 211 210 230 212 213 236 205 165 105 206 181 149 Table 3 Average results VAM Volume/m3 Time/s Q/m3s-1 5 12 20 0.010 0.024 0.040 121.32 130.94 127.52 8.24x10⁻⁵ 1.68x10⁻⁴ 3.17x10⁻⁴ 1 2 3 4 5 6 7 8 /mm /mm /mm /mm /mm /mm /mm /mm 273 312 381 257 240 196 265 283 331 263 272 299 211 213 229 211 216 233 203 168 106 206 184 149 Using the values in Table 3, the calculated flow rate through each meter can be compared to the “real” flow rate (measured by timing a certain volume output). The comparison can be seen in Table 4 below. Table 4 Comparison of calculated volumetric flow rates “Real” Q Venturi-calculated Q VAM-calculated Q Orifice Plate-calculated Q 8.24x10⁻⁵ 1.03x10⁻⁴ 8.33x10⁻⁵ 7.84x10⁻⁵ -4 -4 -4 1.84x10 2.16x10 2.00x10 1.75x10⁻⁴ 3.14x10⁻⁴ 3.46x10⁻⁴ 3.33x10⁻⁴ 2.87x10⁻⁴ To illustrate the difference visually, Figure 5 shows the difference graphically. Fig. 5 Chart showing the calculated flow rate for certain rates From the data and the chart, it is easy to see that the Variable Area Meter is the most accurate. However, this does not tell the whole story. What matters most is not the absolute error, but the inconsistency of any error. For example, if each of the Venturi measurements was exactly half of the “Real” flow rate, it would be a very good approximation of the flow – one could simply factor in a multiplication of two into the equation for calculating Q. The equation then becomes: Where Cd is a constant that could in theory improve the accuracy of the meters that use this method to calculate Q (The Venturi Meter and the Orifice Plate)[7]. Through averaging the percentage difference for each flow value, the values of Cd were calculated as 0.853 for the Venturi Meter and 1.07 for the Orifice Plate. With this value for Cd factored in, the comparable values becomes those in Table 5: Table 5 Comparison of calculated volumetric flow rates with Cd factored in. “Real” Q Venturi-calculated Q VAM-calculated Q Orifice Plate-calculated Q -5 8.24x10 8.79x10⁻⁵ 8.33x10⁻⁵ 8.39x10⁻⁵ 1.84x10⁻⁴ 1.84x10⁻⁴ 2.00x10⁻⁴ 1.87x10⁻⁴ 3.14x10⁻⁴ 2.95x10⁻⁴ 3.33x10⁻⁴ 3.07x10⁻⁴ Visually, the result is even more pronounced, as shown in the chart in Figure 6 Fig. 6 Chart showing the calculated flow rate for certain rates, with Cd factored in With the coefficient factored in, the results become far more accurate, and the Orifice Plate emerges as the best. While this is at first surprising (in theory the Orifice Plate should have more losses than an equivalent Venturi meter), the fact that Cd has been factored in means that if the proportional change is most associated (as perhaps the geometry of the Orifice allows) it will be most accurate, regardless of gross accuracy with no adjustments. One should note the calculated flow rates are extremely accurate at the lowest rate (5 litres/ second) but become far more proportionally volatile at higher rates (12 and 20 litres/second). This suggests there could be more losses or greater potential for error at higher speeds – water levels could “wave” more and turbulence could occur. There is also greater chance of air bubbles infiltrating unnoticed. Head Loss Evaluation There is a striking difference in the head losses across the different meters, made clear by the differences in measured height in Table 3. In summary: 1. Venturi Meter. (Head loss between points 1 and 3.) The change in head loss between high and low Q is 0.042m. 2. Variable Area Meter. (Head loss between points 4 and 5.) The change in head loss between high and low Q is 0.018m. 3. Orifice Plate. (Head loss between points 6 and 8.) The change in head loss between high and low Q is 0.079m. As we can see, the meter with the lowest change in head loss (the most consistent losses) is the Variable Area Meter, followed by Venturi Meter and then the Orifice Plate. This is most likely because the Variable Area Meter is dynamic (in that it changes form as the flow rate increases), while the Venturi Meter and Orifice Plate are static and do not adapt to higher flow rates. References and Sources (See superscripted citation notation.) 1. http://mech207.engr.scu.edu/SensorPresentations/Atta%20%20Venturi%20Meter%2 0Combined.pdf 2. http://amser.org/index.php?P=AMSER--ResourceFrame&resourceId=9776 3. J.F. Douglas, J.M. Gasiorek, J.A. Swaffield. 2011. Fluid Mechanics VI, Prentice Hall. 4. http://www.efunda.com/designstandards/sensors/flowmeters/flowmeter_va.cfm 5. http://www.pc-education.mcmaster.ca/Instrumentation/flow.htm 6. http://www.tpub.com/content/neets/14175/css/14175_57.htm 7. http://www.cs.cdu.edu.au/homepages/jmitroy/eng243/VenturiMeter.pdf Edward Crinion 600017271 Sunday 30 October 2011 ECM2113 Thermofluid Engineering
