Chapter IV
advertisement
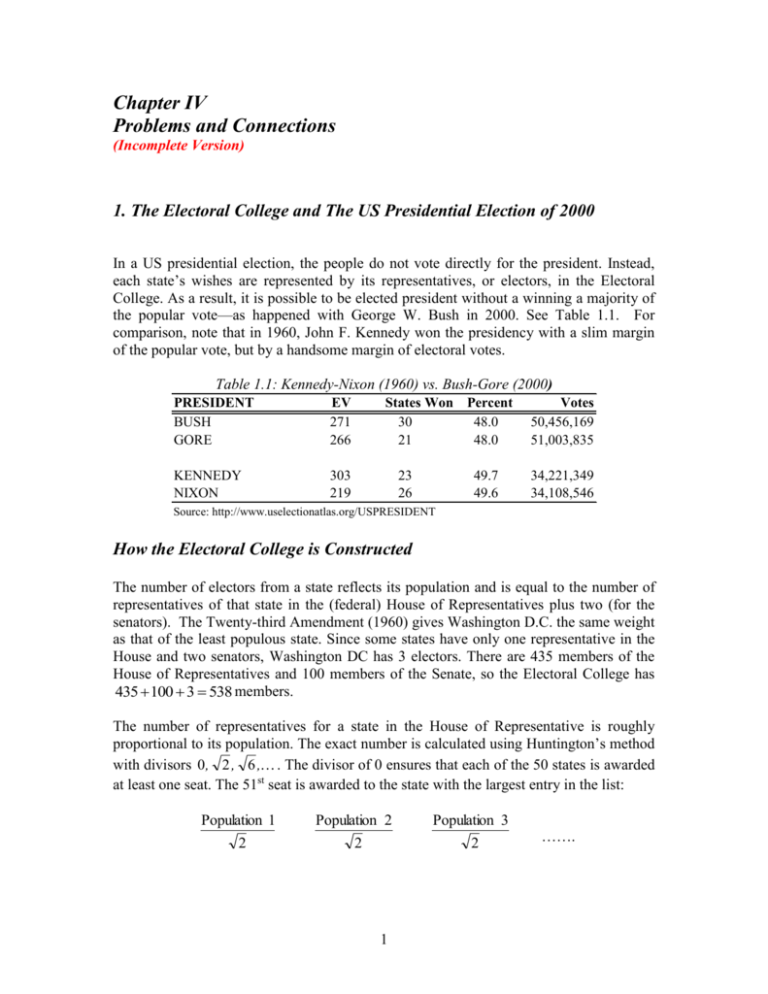
Chapter IV Problems and Connections (Incomplete Version) 1. The Electoral College and The US Presidential Election of 2000 In a US presidential election, the people do not vote directly for the president. Instead, each state’s wishes are represented by its representatives, or electors, in the Electoral College. As a result, it is possible to be elected president without a winning a majority of the popular vote—as happened with George W. Bush in 2000. See Table 1.1. For comparison, note that in 1960, John F. Kennedy won the presidency with a slim margin of the popular vote, but by a handsome margin of electoral votes. Table 1.1: Kennedy-Nixon (1960) vs. Bush-Gore (2000) PRESIDENT BUSH GORE EV 271 266 KENNEDY NIXON 303 219 States Won Percent 30 48.0 21 48.0 23 26 49.7 49.6 Votes 50,456,169 51,003,835 34,221,349 34,108,546 Source: http://www.uselectionatlas.org/USPRESIDENT How the Electoral College is Constructed The number of electors from a state reflects its population and is equal to the number of representatives of that state in the (federal) House of Representatives plus two (for the senators). The Twenty-third Amendment (1960) gives Washington D.C. the same weight as that of the least populous state. Since some states have only one representative in the House and two senators, Washington DC has 3 electors. There are 435 members of the House of Representatives and 100 members of the Senate, so the Electoral College has 435 100 3 538 members. The number of representatives for a state in the House of Representative is roughly proportional to its population. The exact number is calculated using Huntington’s method with divisors 0 , 2 , 6 , . The divisor of 0 ensures that each of the 50 states is awarded at least one seat. The 51st seat is awarded to the state with the largest entry in the list: Population 1 Population 2 Population 3 2 2 2 1 ……. This will be the state with the largest population, currently California. We will assume that the populations are arranged in decreasing order, so Population 1 is California. The 52nd seat is awarded to the state with the largest entry in the array: Population 2 Population 3 Population 1 2 Population 2 2 Population 3 6 6 6 …… …… In the 2000 census, the largest state was California, with a population of 33,930,798, followed by Texas with a population of 20,903,994 and New York with 19,004,973. The entries in the array are California 13,852,190.28 Texas New York 14,781,355.91 13,438545.28 …… 8,534,019.81 7,758,747.74 …… Thus, Texas gets the 52nd seat, California the 53rd, and New York the 54th. Using the divisors 0, 2 1, 3 2 , 4 3 , n( n 1 ) , , the process is continued until all 435 seats have been assigned. The number of electors for a state is then the number of representatives in the House plus two. The Electoral College figures are updated with every U.S. census, which takes place every ten years; the last one was in 2000. Since the number of electors for a state depends on its population in relation to the total US population, states can lose electors as well as gain them. As the population moves westward, the eastern states tend to lose and the western states tend to gain electors. For comparison: 1996 20004 2004 Number of Electors from California 47 54 55 Number of Electors from New York 36 33 31 How the Electoral College Operates After a presidential election, a state’s electors are usually bound to vote for the candidate who has earned the majority of votes in that state. In effect, each state votes for one presidential candidate, with a weighting given by its number of votes in the Electoral College. 2 What Minimum Fraction of the Popular Vote Must a President Win? We consider the U.S. presidential elections of 2000. What is the minimum fraction of the popular vote that would have allowed G. W. Bush to win the election? To answer this question, we assume that there are only two candidates. Let T be the total number of votes cast in the election. Let W be the number of votes earned by the winning candidate. The number of representatives for state i is denoted by ri. Thus the number of electoral votes for this state is ri 2 . We let vi designate the number of votes cast in this state. Finally, by s, we denote the number of states won by the winning candidate. The quantity W / T measures the proportion of the popular vote won by the elected president. There are a total of 538 electoral votes, so all a winner needs is 270 of them. This translates into (r1 2) (r2 2) (rs 2) 270, or r1 r2 rs 270 2s. (1) We assume that, on average, the number of votes cast in a given state is proportional to its population, and therefore to its number of representatives. This translates into the equation vi Kri , (2) where K is a very large number. Summing over all the states yields T K ri i Since r i 435, the size of the House of Representatives, we have i K T 435 (3) The figures for the 2000 elections (see Table 1.1) give an approximate value of K 233,250. To win the ri 2 electoral votes of a given state, a candidate needs at least half of the votes cast plus one, or vi 2 1 , of the popular vote in the state. This means a winning candidate will have v v v W 1 1 2 1 s 1. 2 2 2 3 Equation (2), vi Kri , then gives Kr Kr Kr W 1 1 2 1 s 1 , 2 2 2 or, factoring out K 2 and adding the 1’s, K W (r1 r2 rs ) s. 2 (4) Dividing by T 435K and using (1) leads to W 270 2 s s . T 870 435 K (5) Since the term s ( 435K ) is at most 50/101,463,945 4.92 10 -7 , or essentially zero, the minimum fraction W/T needed by a winning candidate is W 270 2 s . T 870 (6) Going after the most populous states in Table 1.2, we see that 11 states are needed to obtain 270 electoral votes. Substituting into equation (6) yields a minimum percentage of W 270 2 11 28.51%. T 870 Thus, a candidate who wins the 11 most populous states can be elected with 28.51% of the vote. 4 However, the expression for W/T has a negative slope, so it is possible to push this figure down further if the candidate wins a larger number of states, provided the number of electoral votes is barely 270. To amass as many states as possible, we chose those with the smallest number of electoral votes. Arranging the states in increasing order of electoral votes, we start counting the states until the sum of the electoral votes just reaches 270. See Table 1.3. With 39 states, we have 255 electoral votes. An additional state with 13 electoral votes would put us at 268; adding the next state would take us well over 270. If we drop this state with 13 electoral votes and replace it with a state with 15 electoral votes, we just reach 270 electoral votes. In this case, 40 states are required to win the election. This entails a minimum popular vote of W 270 2 40 21.84% . T 870 Going after small states amounts to garnering as many “senatorial weights” as possible. Using this strategy, all Bush needed was 21.84% of the popular vote in 40 states. Table 1.3: Electoral Votes Arranged in Increasing Order (1991-2000) EV States EV*n n Sum of EVs 3 4 5 6 7 8 9 10 11 12 13 14 15 8 6 4 2 3 6 2 2 4 2 2 1 1 24 24 20 12 21 48 18 20 44 24 26 14 15 8 14 18 20 23 29 31 33 37 39 41 42 43 24 48 68 80 101 149 167 187 231 255 281 295 310 In actual fact Bush gathered exactly 271 electoral votes from thirty states. Substituting s 30 gives the minimum popular vote that would have elected Bush in 2000, that is, W 270 2 30 24.25%. T 870 Similar questions were addressed by George Pólya concerning the 1960 election between Nixon and Kennedy (see Table 1.1). Kennedy would have required only 22.08% to win were he to amass all the states with least representatives in the House. Had he gone after the largest states, he would have needed just 28.03% of the popular vote. In fact, with his 23 states (see Table 1.1) Kennedy could have won that election with as little as 25.51% of the popular vote. 5 EXERCISES 1. Use the Electoral College figures for 1960 provided in the Excel file electoralv.xls to find the least fraction figures cited above. Hint: You need to first derive a formula equivalent to (6) with 537 electoral votes.1 2. Use the 2000 U.S. census data provided in the file electoral-college2000.xls and the file huntington50parties500seats.xls to find the number of representatives for 2001-2010 for each state in the House of Representatives. Thus find Electoral College distribution for the upcoming Presidential Election of 2004. Do these agree with the published figures given in electoral-v.xls? 3. The Electoral College figures for 2001-2010 will be used in the 2004 and 2008 U.S. presidential elections.2 Use the figures provided in the Excel file electoralv.xls to predict the least percent a candidate can win the presidency of the US, if (a) He/she went after the most populous states; (b) He/she went after the least populous states. 4. The first sheet of the file electoral-college2015-2025.xls contains two series projections for the U.S. population by state for the year 2015. Use the file huntington50parties500seats.xls to find the Electoral College distribution for the year 2015 for both series A and series B. For both series, predict the least percent a candidate can win the presidency of the US, if (a) He/she went after the most populous states; (b) He/she went after the least populous states. 5. Repeat Problem 4 for both series projections for the year 2025. Can one use the figures of 28.5 percent and 21.8 percent as “rules of thumb” (for the next 20 years) for the least possible votes to win the US presidency going respectively after the most populous and least populous states? 1 2 Before 1960, Washington D.C. did not have any electoral votes. The Electoral College figures for the years 1991-2000 were used in the Bush-Gore contest. 6


