Dark Current and Temperature
advertisement
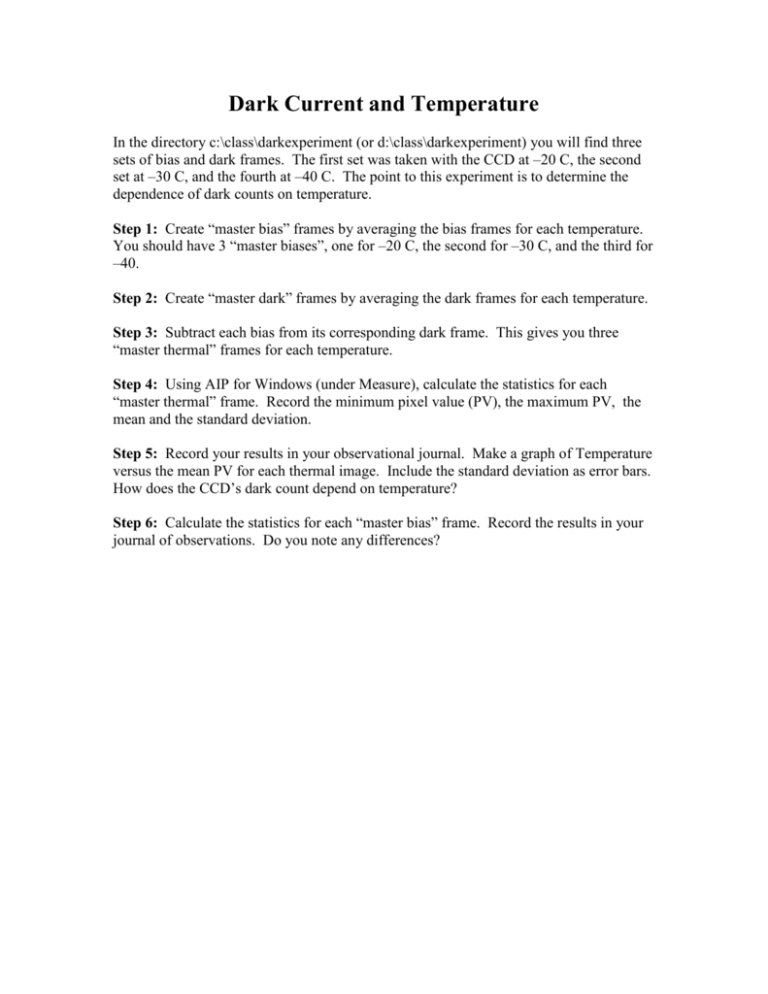
Dark Current and Temperature In the directory c:\class\darkexperiment (or d:\class\darkexperiment) you will find three sets of bias and dark frames. The first set was taken with the CCD at –20 C, the second set at –30 C, and the fourth at –40 C. The point to this experiment is to determine the dependence of dark counts on temperature. Step 1: Create “master bias” frames by averaging the bias frames for each temperature. You should have 3 “master biases”, one for –20 C, the second for –30 C, and the third for –40. Step 2: Create “master dark” frames by averaging the dark frames for each temperature. Step 3: Subtract each bias from its corresponding dark frame. This gives you three “master thermal” frames for each temperature. Step 4: Using AIP for Windows (under Measure), calculate the statistics for each “master thermal” frame. Record the minimum pixel value (PV), the maximum PV, the mean and the standard deviation. Step 5: Record your results in your observational journal. Make a graph of Temperature versus the mean PV for each thermal image. Include the standard deviation as error bars. How does the CCD’s dark count depend on temperature? Step 6: Calculate the statistics for each “master bias” frame. Record the results in your journal of observations. Do you note any differences?


