Graphing Cubic, Square Root and Cube Root Functions
advertisement

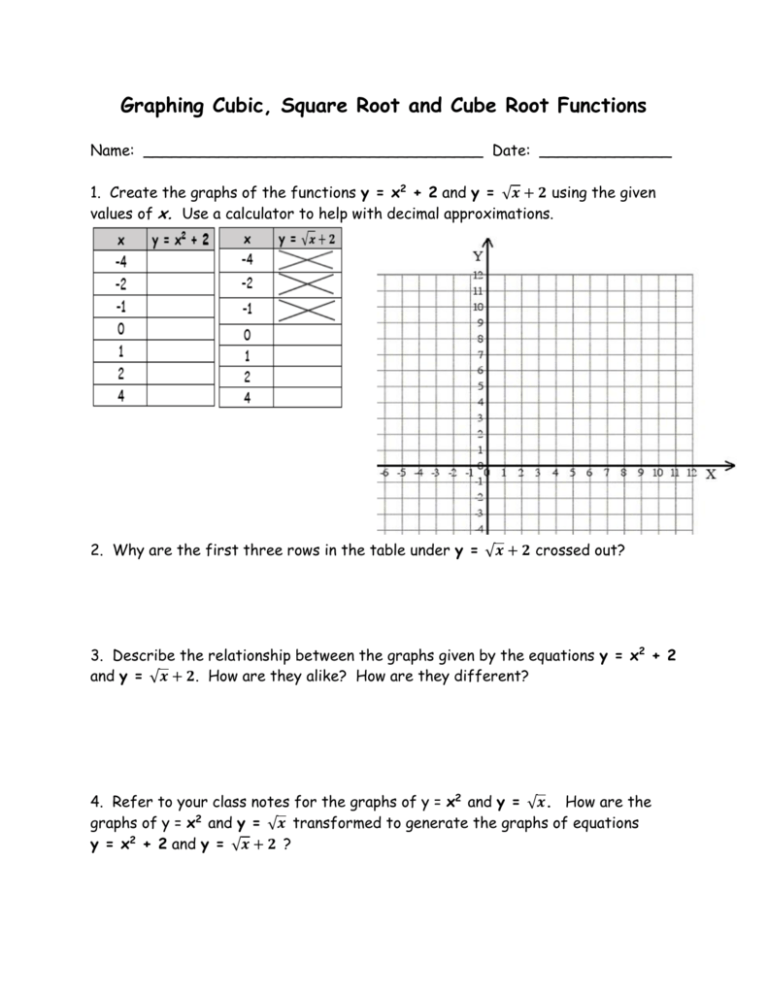
Graphing Cubic, Square Root and Cube Root Functions Name: ____________________________________ Date: ______________ 1. Create the graphs of the functions y = x2 + 2 and y = √𝒙 + 𝟐 using the given values of x. Use a calculator to help with decimal approximations. 2. Why are the first three rows in the table under y = √𝒙 + 𝟐 crossed out? 3. Describe the relationship between the graphs given by the equations y = x2 + 2 and y = √𝒙 + 𝟐. How are they alike? How are they different? 4. Refer to your class notes for the graphs of y = x2 and y = √𝒙. How are the graphs of y = x2 and y = √𝒙 transformed to generate the graphs of equations y = x2 + 2 and y = √𝒙 + 𝟐 ? 5. Create the graphs of the functions 𝟑 y = x3 - 2 and y = √𝒙 − 𝟐 using the given values for x. Use a calculator to help with decimal approximations. 6. Why aren’t there any rows crossed out in this table? 7. Describe the relationship between the domain and ranges of the functions 𝟑 y = x3 - 2 and y = √𝒙 − 𝟐. Describe the relationship between their graphs. 8. Refer to your class notes for the graphs of y = x3 and y = √𝒙. How are the 𝟑 graphs of y = x3 and y = √𝒙 transformed to generate the graphs of y = x3 - 2 𝟑 and y = √𝒙 − 𝟐 ? 𝟑 9. Create your own functions using y = x2 - _____ and y = √𝒙 - ____ by filling in the blank with a positive or negative number. 10. Predict how the graphs of your functions will compare to the graphs of their parent functions based on the number you put on the blank line. 11. Generate a table of values for your each of your functions. 12. Graph your two functions.


