Quality of Income Data: Rounding Behaviour (1) CHINTEX The
advertisement
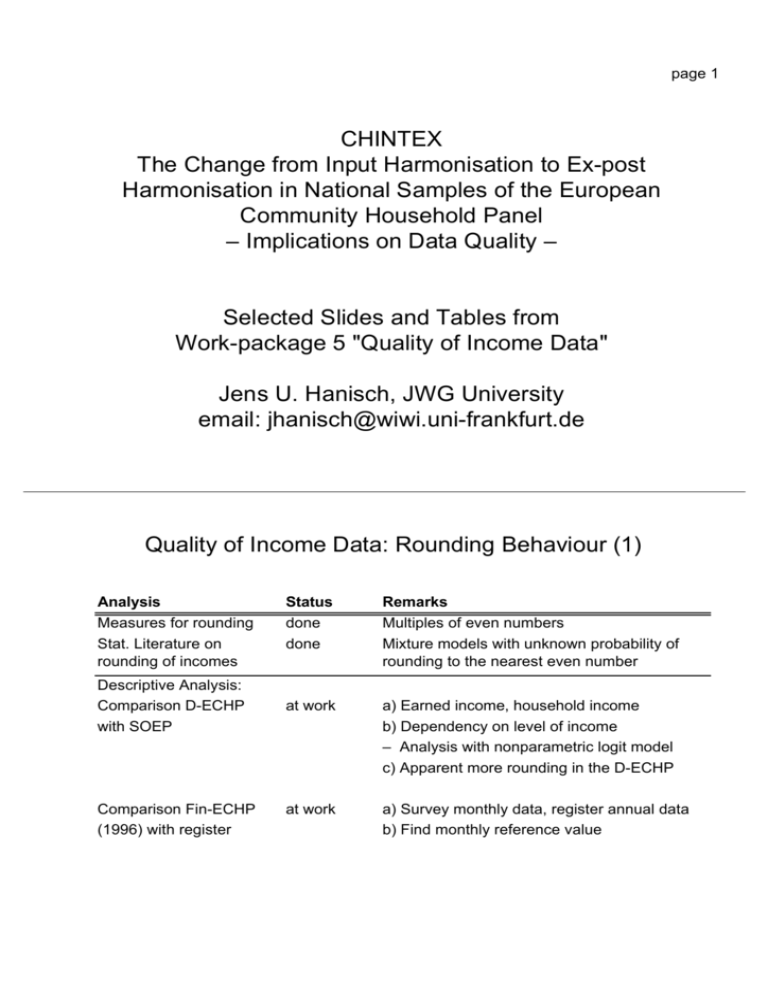
page 1 CHINTEX The Change from Input Harmonisation to Ex-post Harmonisation in National Samples of the European Community Household Panel – Implications on Data Quality – Selected Slides and Tables from Work-package 5 "Quality of Income Data" Jens U. Hanisch, JWG University email: jhanisch@wiwi.uni-frankfurt.de Quality of Income Data: Rounding Behaviour (1) Analysis Measures for rounding Stat. Literature on rounding of incomes Descriptive Analysis: Comparison D-ECHP with SOEP Comparison Fin-ECHP (1996) with register Status done done Remarks Multiples of even numbers Mixture models with unknown probability of rounding to the nearest even number at work a) Earned income, household income b) Dependency on level of income – Analysis with nonparametric logit model c) Apparent more rounding in the D-ECHP at work a) Survey monthly data, register annual data b) Find monthly reference value page 2 Rounding in D-ECHP and SOEP Data: Net Household Income Observations: Household Questionnaires Rounding of Household Net Disposable Income D-ECHP, 1994-1996, non-anonymized data rounding HH net income 1994 rounding HH net income 1995 rounding HH net income 1996 Count 507 % 12,6% Count 566 % 14,5% Count 509 % 13,3% yes, 100 1742 43,1% 1691 43,3% 1757 46,1% yes, 500 688 17,0% 632 16,2% 577 15,1% yes, 1000 904 22,4% 798 20,5% 766 20,1% yes, 5000 177 4,4% 191 4,9% 170 4,5% yes, 10000 20 ,5% 24 ,6% 34 ,9% 4038 100,0% 3902 100,0% 3813 100,0% no Total Rounding of Household Net Disposable Income SOEP, 1994-1996, Samples A+C rounding HH net income 1994 rounding HH net income 1995 rounding HH net income 1996 Count 902 % 17,0% Count 939 % 18,1% Count 852 % 16,5% yes, 100 2265 42,6% 2203 42,5% 2156 41,7% yes, 500 798 15,0% 774 14,9% 819 15,8% yes, 1000 1115 21,0% 1028 19,8% 1043 20,2% yes, 5000 209 3,9% 217 4,2% 269 5,2% no yes, 10000 Total 27 ,5% 28 ,5% 32 ,6% 5316 100,0% 5189 100,0% 5171 100,0% Comments: It is easy to see that the number of values which are not rounded is approximately 3-4% higher in the SOEP than in the D-ECHP for the same reporting periods. Since the SOEP is running longer, this indicates that people tend to tell exact numbers more likely when panel participation duration increases. However, for a further analysis and hypothesis testing it is necessary to take item non-response and bracket usage into account. page 3 Rounding in D-ECHP and SOEP Data: Personal Wage and Earnings Observations: Personal Questionnaires Rounding of Personal Gross Earnings D-ECHP, 1994-1996, non-anonymized data rounding personal wage and earnings 1994 Count no % rounding personal wage and earnings 1995 Count % rounding personal wage and earnings 1996 Count % 609 16,5% 758 19,7% 647 17,3% yes, 100 1977 53,5% 1986 51,7% 1954 52,3% yes, 500 479 13,0% 510 13,3% 521 13,9% yes, 1000 515 13,9% 504 13,1% 505 13,5% yes, 5000 95 2,6% 79 2,1% 100 2,7% yes, 10000 20 ,5% 6 ,2% 11 ,3% 3695 100,0% 3843 100,0% 3738 100,0% Total Rounding of Personal Gross Earnings SOEP, 1994-1996 rounding personal wage and earnings 1994 rounding personal wage and earnings 1995 rounding personal wage and earnings 1996 Count 1927 % 34,2% Count 1940 % 34,4% Count 1894 % 34,3% yes, 100 2410 42,7% 2381 42,2% 2318 41,9% yes, 500 584 10,4% 601 10,6% 588 10,6% yes, 1000 577 10,2% 586 10,4% 588 10,6% yes, 5000 113 2,0% 114 2,0% 105 1,9% yes, 10000 30 ,5% 24 ,4% 34 ,6% 5641 100,0% 5646 100,0% 5527 100,0% no Total Comments: On personal level, the difference between the SOEP and the D-ECHP is very easy to see. In addition to the absolute difference in rounding, it seems that of those who do round, persons in the SOEP seem to round less likely to multiples of 1000 and higher, more likely to 100. Thus, it can be assumed that rounding causes a lower measurement error in the SOEP than in the D-ECHP. page 4 Rounding of Personal Earnings vs. Earnings level data: SOEP 1996 personal questionnaire 100% 90% 80% type of rounding 70% 60% 50% 40% 30% 20% 10% 0% 1-1750 DEM 17512250 DEM 22512750 DEM 27513250 DEM 32513750 DEM 37514250 DEM 42514750 DEM 47515250 DEM 5251> 7750 7750 DEM DEM 34 yes, 10000 97 yes, 5000 33 yes, 1000 74 146 110 125 139 117 8 109 101 137 24 yes, 500 61 yes, 100 274 202 265 312 302 276 195 150 262 80 no 522 145 152 215 189 175 126 106 201 63 earnings level (grouped) no yes, 100 yes, 500 yes, 1000 yes, 5000 yes, 10000 Rounding of Personal Earnings vs. Earnings level data: SOEP 1996 household questionnaire 100% 90% 80% type of rounding 70% 60% 50% 40% 30% 20% 10% 0% up to 1750 - 2250 - 2750 - 3250 - 3750 - 4250 - 4750 - 5250 - 7750 32 yes, 10000 268 yes, 5000 yes, 1000 7751 and higher 32 174 275 183 266 199 167 1 195 101 yes, 500 94 155 21 yes, 100 236 244 272 279 256 202 205 155 259 48 no 211 138 106 101 80 52 45 26 67 26 income level (grouped) no yes, 100 yes, 500 yes, 1000 yes, 5000 yes, 10000 page 5 Rounding of Personal Earnings vs. Earnings level data: D-ECHP 1996 personal questionnaire 100% 80% type of rounding 60% 40% 20% 0% 1-1750 DEM 17512250 DEM 22512750 DEM 27513250 DEM 32513750 DEM 37514250 DEM 42514750 DEM 47515250 DEM 5251> 7750 7750 DEM DEM 11 yes, 10000 96 yes, 5000 23 yes, 1000 51 132 79 135 130 108 4 95 69 108 29 yes, 500 67 yes, 100 290 167 198 243 236 249 139 140 235 57 no 305 53 48 48 46 29 28 24 53 13 earnings level (grouped) no yes, 100 yes, 500 yes, 1000 yes, 5000 yes, 10000 Rounding of Personal Earnings vs. Earnings level data: D-ECHP 1996 household questionnaire 100% 90% 80% type of rounding 70% 60% 50% 40% 30% 20% 10% 0% up to 1750 - 2250 - 2750 - 3250 - 3750 - 4250 - 4750 - 5250 - 7750 34 yes, 10000 168 yes, 5000 yes, 1000 7751 and higher 15 104 211 111 194 132 128 2 161 81 yes, 500 30 148 28 yes, 100 168 188 236 232 206 182 146 115 239 45 no 143 80 46 46 42 38 31 17 52 14 income level (grouped) no yes, 100 yes, 500 yes, 1000 yes, 5000 yes, 10000 page 6 Rounding in Fin-ECHP personal earnings data Rounding of Personal Gross Earnings SF-ECHP, 1996, responder data responder rounding of personal income Count 424 % 9,6% 1044 23,5% yes, 500 835 18,8% yes, 1000 1510 34,0% yes, 5000 251 5,7% yes, 10000 373 8,4% 4437 100,0% no yes, 100 Total Rounding of Personal Gross Earnings Fin-ECHP 1996 (preliminary version) yes, 100 yes, 500 yes, 1000 yes, 10000 no up to 3250 16,9% 30,0% 16,4% 36,7% 100,0% 3251-4750 15,7% 26,3% 28,6% 29,4% 100,0% 4751-6250 15,1% 23,0% 10,2% 26,5% 6251-7750 9,0% 32,5% 30,2% 28,3% 7751-9250 8,9% 30,7% 13,3% 47,1% 9251-10750 6,2% 19,6% 23,4% 10751-12250 6,1% 17,4% 11,1% 65,4% 100,0% 12251-13750 9,4% 18,4% 37,1% 35,1% 100,0% 13751-15250 5,9% 13,5% 11,2% 34,9% 15251-16750 8,4% 14,8% 16,1% 60,6% 16751 and higher 5,3% 8,2% 10,2% 32,7% 15,5% 28,2% 100,0% 9,6% 23,5% 18,8% 34,0% 5,7% 8,4% 100,0% Total yes, 5000 SROUND3: rounding to multiple of "even" number in 1996 (cumulative = 100%) Total % within INCGRP3 25,1% 100,0% 100,0% 100,0% 50,8% 34,5% 100,0% 100,0% 100,0% Comments: Compared to the german panels SOEP and D-ECHP, there is absolutely (% of rounded values) and relatively (amount of rounding in NC) more rounding in the Fin-ECHP. This may be due to the value of the national currency (1 EUR = 1.95583 DEM = 5.94573 FIM). An analysis of rounding in the ECHP with respect to exchange rate is still at work. page 7 Quality of Income Data: Rounding Behaviour (2) Analysis Impact of covariates - gender - panel participation duration Status Remarks just started just started Apparent differences Separation of survey and panel effect Effect of rounding - FIN-ECHP (1996-2000) vs. Register deferred deferred Emphasis on stability (definition required) blocked by data delivery (Autumn 2001) second problem: monthly / annual data - D-ECHP vs. SOEP - UK-ECHP vs. BHPS deferred deferred page 8 Quality of Income Data: Bracket Use Analysis Descriptive Analysis - percentage Status Remarks at work Drop of rates from wave 1 to 3 in D-ECHP, LuxECHP (as predicted) - pattern Determinants for bracket use Distribution of income within brackets at work not started temporal dependencies Ordered probit model Implication for Imputation package - D-ECHP vs. SOEP - Fin-ECHP vs. SOEP not started not started Problems with comparability Bracket Use in Panel Surveys Number of Responses using Values or Brackets for Household Income Dataset SOEP D-ECHP 1994 D-ECHP 1995 D-ECHP 1996 Fin-ECHP 1996 Lux-ECHP 1994 Lux-ECHP 1995 Lux-ECHP 1996 as Value 6554 4038 3902 3891 3186 523 526 597 as Bracket (%) not an option 852 (17%) 682 (15%) 605 (13%) 870 (21%) 473 (47%) 408 (44%) 312 (34%) page 9 1994 item nonresponse 1995 no interview 9,3% item nonresponse 0,4% bracket 33,9% Visualization of the Change of Responder Behaviour regarding Bracket Usage for Household Income Data: D-ECHP 1994-1996 percent: Percentage of responders starting in wave 1 with "bracket usage" bracket 52,5% 3,9% value, rounded value value, not rounded 1994 1996 15,8% 0,4% bracket no interview item nonresponse 31,0% bracket 49,0% value, rounded 3,9% value, not rounded page 10 Visualization of the Change of Responder Behaviour regarding Bracket Usage for Household Income 1995 1996 no interview Data: D-ECHP 1994-1996 upper chart: conditional on bracket usage in wave 2 5,3% item nonresponse 0,7% lower chart: conditional on bracket usage in wave 1 and wave 2 bracket 35,3% bracket 54,7% percent: Percentage of responders starting in wave 1 with "bracket usage" value, rounded 3,9% value, not rounded 1994 1996 1995 no interview 8,7% 0% bracket 33,9% bracket item nonresponse 50% bracket 37,8% value, rounded 3,5% value, not rounded
