The Natural Number
advertisement
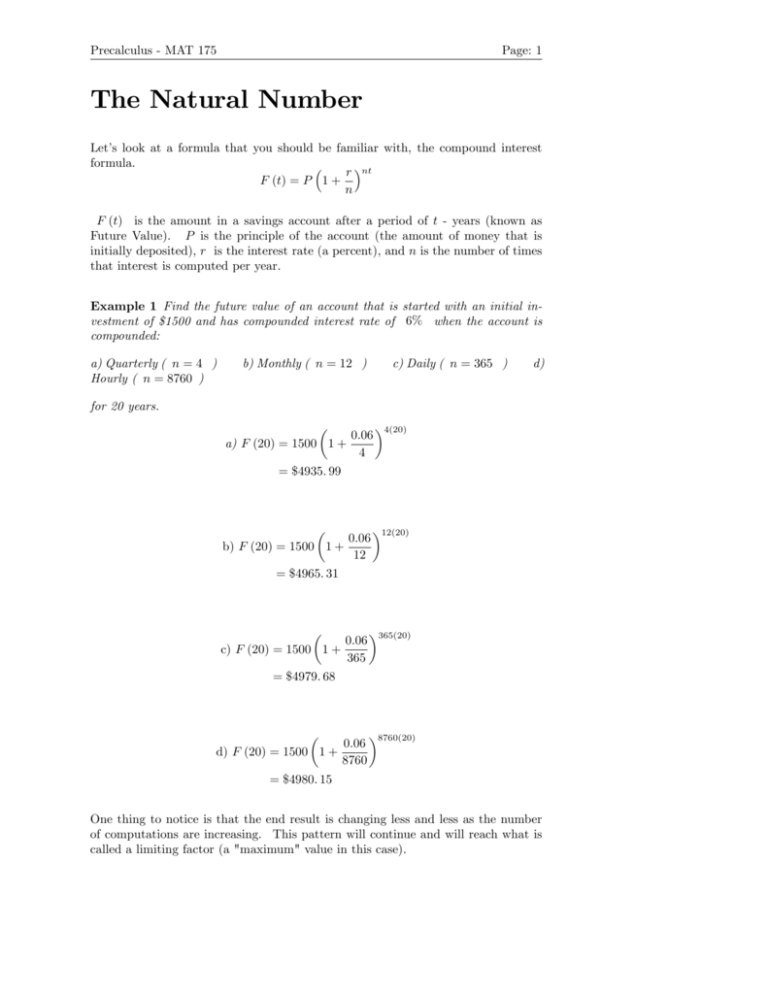
Precalculus - MAT 175 Page: 1 The Natural Number Let’s look at a formula that you should be familiar with, the compound interest formula. r nt F (t) = P 1 + n F (t) is the amount in a savings account after a period of t - years (known as Future Value). P is the principle of the account (the amount of money that is initially deposited), r is the interest rate (a percent), and n is the number of times that interest is computed per year. Example 1 Find the future value of an account that is started with an initial investment of $1500 and has compounded interest rate of 6% when the account is compounded: a) Quarterly ( n = 4 ) Hourly ( n = 8760 ) b) Monthly ( n = 12 ) c) Daily ( n = 365 ) d) for 20 years. a) F (20) = 1500 1 + 0:06 4 4(20) 0:06 12 12(20) = $4935: 99 b) F (20) = 1500 1 + = $4965: 31 c) F (20) = 1500 1 + 0:06 365 365(20) 0:06 8760 8760(20) = $4979: 68 d) F (20) = 1500 1 + = $4980: 15 One thing to notice is that the end result is changing less and less as the number of computations are increasing. This pattern will continue and will reach what is called a limiting factor (a "maximum" value in this case). Precalculus - MAT 175 1 Page: 2 Natural Number Let us look at the important part of this formula: f (x) = 1+ 1 x x and see what happens as we let x get as large as we want. x 1 x 2: 593 742 5 2: 704 813 8 2: 716 923 9 2: 718 145 9 2:71826824 1+ x 10 100 1000 10000 100000 Notice that the last two values agree to the thousandths position The value of this as x gets extremely large approaches a value that we call the Natural Number, represented by the letter e = 2: 718 281 8::: This is a number much like , it is an irrational number that has been developed to solve a speci…c problem. 1.1 Graphing the Natural Exponential Function The graph of f (x) = ex is much like the graph of g (x) = 2x , but since e > 2 the graph of f (x) will grow larger quicker than g (x) . ex+2 Example 2 Graph the function f (x) = The (x + 2) moves the graph 2 units to the left and the negative on the function will "‡ip" the graph over the x-axis. Thus the graph will go through the point ( 2; 1) ... y 4 2 x -4 -2 2 4 -2 -4 f (x) = ex + 2 Don’t misinterpret this graph, there is only a horizontal asymptote (y = 0) to this graph. The Domain of the function is still All Real Numbers.


