5 Odds Ratio
advertisement
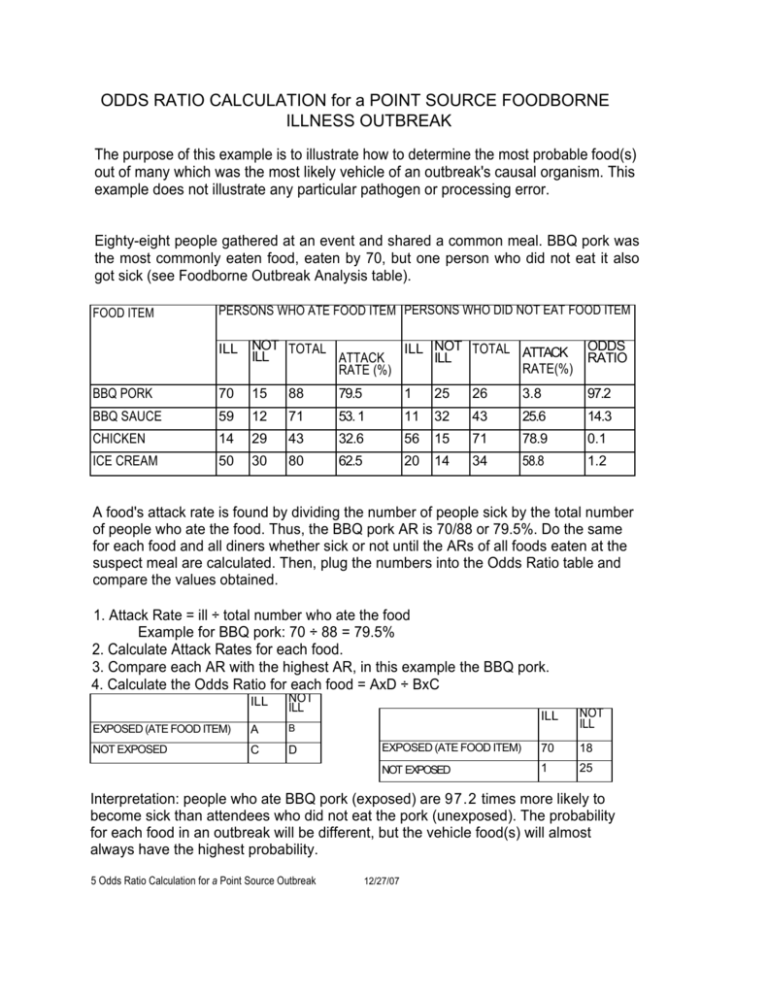
ODDS RATIO CALCULATION for a POINT SOURCE FOODBORNE ILLNESS OUTBREAK The purpose of this example is to illustrate how to determine the most probable food(s) out of many which was the most likely vehicle of an outbreak's causal organism. This example does not illustrate any particular pathogen or processing error. Eighty-eight people gathered at an event and shared a common meal. BBQ pork was the most commonly eaten food, eaten by 70, but one person who did not eat it also got sick (see Foodborne Outbreak Analysis table). FOOD ITEM PERSONS WHO ATE FOOD ITEM PERSONS WHO DID NOT EAT FOOD ITEM ILL NOT TOTAL ILL NOT TOTAL ATTACK ILL ATTACK ILL RATE(%) RATE (%) ODDS RATIO BBQ PORK 70 15 88 79.5 1 25 26 3.8 97.2 BBQ SAUCE 59 12 71 53. 1 11 32 43 25.6 14.3 CHICKEN 14 29 43 32.6 56 15 71 78.9 0.1 ICE CREAM 50 30 80 62.5 20 14 34 58.8 1.2 A food's attack rate is found by dividing the number of people sick by the total number of people who ate the food. Thus, the BBQ pork AR is 70/88 or 79.5%. Do the same for each food and all diners whether sick or not until the ARs of all foods eaten at the suspect meal are calculated. Then, plug the numbers into the Odds Ratio table and compare the values obtained. 1. Attack Rate = ill ÷ total number who ate the food Example for BBQ pork: 70 ÷ 88 = 79.5% 2. Calculate Attack Rates for each food. 3. Compare each AR with the highest AR, in this example the BBQ pork. 4. Calculate the Odds Ratio for each food = AxD ÷ BxC ILL NOT ILL EXPOSED (ATE FOOD ITEM) A B NOT EXPOSED C D ILL NOT ILL EXPOSED (ATE FOOD ITEM) 70 18 NOT EXPOSED 1 25 Interpretation: people who ate BBQ pork (exposed) are 97.2 times more likely to become sick than attendees who did not eat the pork (unexposed). The probability for each food in an outbreak will be different, but the vehicle food(s) will almost always have the highest probability. 5 Odds Ratio Calculation for a Point Source Outbreak 12/27/07

