Math 12, Elementary Statistics Project #1
advertisement
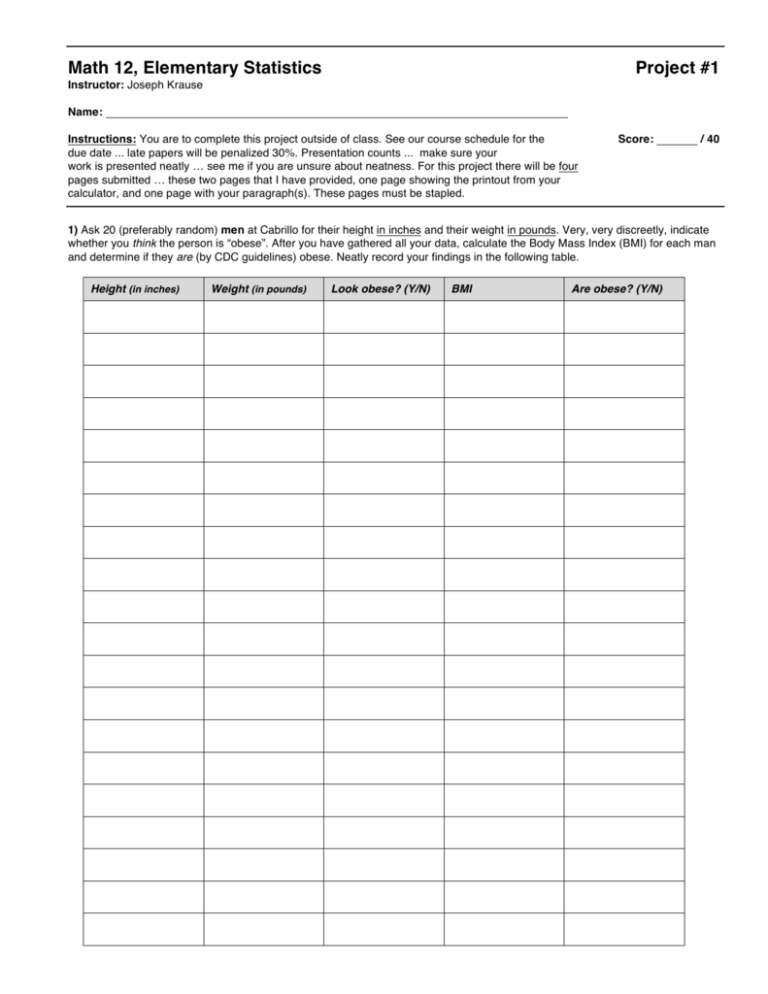
Math 12, Elementary Statistics Project #1 Instructor: Joseph Krause Name: Instructions: You are to complete this project outside of class. See our course schedule for the due date ... late papers will be penalized 30%. Presentation counts ... make sure your work is presented neatly … see me if you are unsure about neatness. For this project there will be four pages submitted … these two pages that I have provided, one page showing the printout from your calculator, and one page with your paragraph(s). These pages must be stapled. Score: / 40 1) Ask 20 (preferably random) men at Cabrillo for their height in inches and their weight in pounds. Very, very discreetly, indicate whether you think the person is “obese”. After you have gathered all your data, calculate the Body Mass Index (BMI) for each man and determine if they are (by CDC guidelines) obese. Neatly record your findings in the following table. Height (in inches) Weight (in pounds) Look obese? (Y/N) BMI Are obese? (Y/N) 2) As demonstrated in class, do a linear regression analysis with height as the independent variable and weight as the dependent variable (be sure to use the y = a + bx form). a) Linear regression model (round to 2 places as necessary): b) Give the correlation coefficient (round to 2 places as necessary): c) Classify the correlation coefficient: d) Give the coefficient of determination (round to 2 places as necessary): e) In a complete sentence, interpret the coefficient of determination. f) Using your linear regression model, predict the weight of a 6’ tall man. Would this man be obese? Explain using numeric detail. 3) On your calculator, prepare one plot showing both the scatter plot of your data and the line of best fit. Be sure to set your window boundaries accordingly ... see me if you are unsure about this. Take your calculator to the Math Learning Center (MLC) in Room 1074 and get your plot printed out. 4) Is there a significant difference between the percentage of your sample that you thought was obese and the percentage that actually is obese? Obesity is often touted as a major health problem in the United States … it’s often referred to as an “epidemic”. Referring to something as an “epidemic” is a pretty big deal … is it reasonable to identify an “epidemic” when the measure is only based on two numeric quantities? What other factors (besides height and weight, hence BMI) could conceivably be taken into consideration? Write a paragraph (or two) addressing these questions. Your paragraph(s) must be word-processed, not handwritten.
