RPI Consultation Paper History of elementary aggregate formula in
CONFIDENTIAL ‐ STATISTICS
Consideration by the ONS of elementary aggregate formulae in the Retail Prices Index: a short history
Although there were occasional official comparisons of food in the late 19 th
century and early 20 th
century, the
Government first began a systematic, continuous check on the increase in the cost of living in 1914.
The new protecting
was accepted ordinary
as workers
a valuable from what
aid were towards initially expected to be temporary economic consequences of the First World War.
The ‘cost of living index’, with unchanged weights, was produced throughout the
1920s and 1930s.
Criticism mounted, especially in relation
Ministry large the by
‐ index to of scale
weights; the broken
deferred
its out
‐ of ‐ date weights.
announced household time out
Labour this the and until
the
was
the expenditure carried results further war
had
out become action
in on finished.
In introduction inquiry
1937 ‐
8.
available,
the
1936,
to
update
However, war revisions
the of a had was
In 1946 a new committee, the Cost of Living Advisory
Committee, was set up.
An interim report in 1947 recommended the removal of the name ‘cost of living index’ and the associations it implied.
This new index, the Interim Index of Retail Prices, started in June 1947.
The RPI as it is currently composed began in 1956.
It was initiated as a costs of goods index (COGI) rather than level the ratio
provided by the Cost of Living Advisory Committee, which became the RPI Advisory Committee (RPIAC) in an effort to move people away from the perception that the index was a COLI.
Original decisions on the formulae
(Carli)
(where
Technical outset of
a
–
the
cost
to
averages see options
of use no
Working
Box
living for weights
(Dutot)
1.
index items
appear at
and
Party
were to
(COLI).
the of
the have
average
Governance elementary available) of
RPIAC.
been
were
price
From
between
was aggregate taken by the the relatives
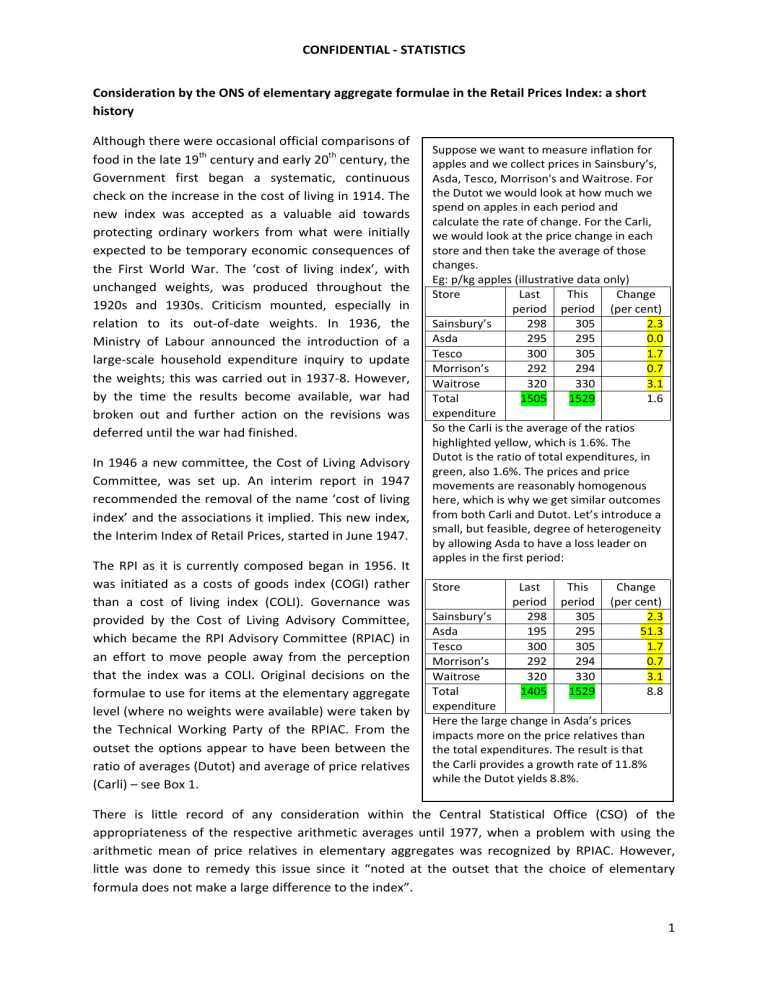
Suppose we want to measure inflation for apples and we collect prices in Sainsbury’s,
Asda, Tesco, Morrison's and Waitrose.
For the Dutot we would look at how much we spend on apples in each period and calculate the rate of change.
For the Carli, we would look at the price change in each store and then take the average of those changes.
Eg: p/kg apples (illustrative data only)
Store Last period
This period
Change
(per
cent)
Sainsbury’s
Asda
Tesco
Morrison’s
Waitrose
298
295
300
292
320
305
295
305
294
330
2.3
0.0
1.7
0.7
3.1
Total expenditure
1505 1529
So the Carli is the average of the ratios highlighted yellow, which is 1.6%.
The
1.6
Dutot is the ratio of total expenditures, in green, also 1.6%.
The prices and price movements are reasonably homogenous here, which is why we get similar outcomes from both Carli and Dutot.
Let’s introduce a small, but feasible, degree of heterogeneity by allowing Asda to have a loss leader on
apples in the first period:
Store Last period
This period
Sainsbury’s
Asda
298
195
305
295
Change
(per
cent)
2.3
51.3
Tesco
Morrison’s
Waitrose
Total expenditure
300
292
320
1405
305
294
330
1529
Here the large change in Asda’s prices impacts more on the price relatives than the total expenditures.
The result is that the Carli provides a growth rate of 11.8% while the Dutot yields 8.8%.
1.7
0.7
3.1
8.8
There is little record of any consideration within the Central Statistical Office (CSO) of the appropriateness of the respective arithmetic averages until 1977, when a problem with using the arithmetic mean of price relatives in elementary aggregates was recognized by RPIAC.
However, little was done to remedy this issue since it “noted at the outset that the choice of elementary formula does not make a large difference to the index”.
1
CONFIDENTIAL ‐ STATISTICS
By the early 1980s RPIAC had been reconvened to review the RPI, but did not (as far as we can tell) consider the elementary aggregate issue.
The Wilson Report published in 1980 recommended that the UK government issues index linked gilts for pension funds and these were introduced in 1981.
Later in the 1980s a report on “Methodological Issues affecting the Retail Prices Index” was published by RPIAC, but again did not consider the averaging formulae at the elementary level.
At the end of the 1980s responsibility for the RPI transferred from the Employment Department to the CSO, but importantly, responsibility for the scope and definition of the index remained under the control of Ministers (the Chancellor instead of the Secretary of State for Employment), not the
Director of the CSO.
In 1994 RPIAC met for the last time and published a report relating to the house depreciation costs component of the RPI.
In the same year, Bohdan Schultz, from Statistics Canada’s Prices Division submitted a paper to the first meeting of the Ottawa Group, a UN sponsored ‘city group’, highlighting the real problems that using the Carli can create in a consumer price index.
The next year the European Union introduced regulations providing for the construction of a harmonised index of consumer prices, the development of which occupied NSIs around Europe (the HICP was first published in 1996).
The regulation effectively bans the use of the Carli formula in the HICP and official documentation states “the decision to rule out its use was not taken on the grounds that it is generally accepted as wrong, but rather that it does not give results which are ‘comparable’ to those given by other formulae.” However, in a recent discussion with Erwin Diewert, he suggested that participants from Eurostat at the first meeting of the Ottawa group “took the advice to heart and banned the use of the Carli index in the HICP due to its built in upward bias.”
In 1996 the CSO morphed into ONS but again governance of the RPI remained unchanged, with scope and definition remaining with the Chancellor.
At the same time, the US saw the publication of the Boskin Report.
This increased debate internationally on measurement bias in consumer price statistics and reignited COGI or COLI arguments (Boskin favoured the latter).
Given this, ONS published a couple of documents looking at the implications of Boskin for the UK’s RPI.
These papers concluded that the US CPI aspires to be a COLI, and many methodological decisions are taken in a cost of living framework.
By contrast, RPI advisory committees have recommended that the RPI should not be a cost of living index.
The papers acknowledged that the argument over whether the geometric average (Jevons) formula is better than the arithmetic formulae (Carli and Dutot) is not clear cut and depends on consumer reaction to price changes.
Boskin estimated a formula bias of
0.25
percentage points in the US CPI.
ONS statisticians thought the effect of moving to Jevons in the
UK was likely to be lower because the Dutot formula (rather than Carli) was used for a substantial number of items.
Further research was proposed to investigate the true impact.
With the advent of the HICP the UK had two measures of inflation and began to see the consequences of that, in the shape of the formula effect.
As a consequence, ONS began research looking at the factors driving the gap, with the main work starting towards the end of the 1990s.
The status of the HICP increased at the start of 1999 when the HICP was used to meet the requirements of the Maastricht Treaty and subsequently for the measurement of price stability across the euro area by the ECB.
The same year saw ONS setting out a three year work programme on the RPI methodology, with nine workstreams, one of which was to look at the formula to use at the elementary aggregate level.
2
CONFIDENTIAL ‐ STATISTICS
In 2000 the Framework for National Statistics was published, but again, responsibility for RPI remained unchanged.
That year, ONS produced an internal paper with a recommendation not to use the Carli, or at the very least to produce a statistical design that reduces the impact of its use, and started to look at issues around the substitution effect.
Over the next couple of years ONS looked at the impact of switching the formula away from the Carli.
The pervading governance arrangements for the RPI at that time are important, since they appear to have inhibited action on the Carli.
That is because a switch from Carli to Jevons was deemed to be one that would change the nature of the index away from a COGI, (with the economic argument suggesting that Jevons compensated for substitution bias better than the Carli).
As such, this was an issue for the Chancellor, and it appears that ONS did not consider pressing the argument for a change, and by 2002 ONS had concluded that the use of the Jevons should be ruled out because “taking into account substitution that takes place within an elementary aggregate within a chain is 'alien to a fixed basket index'”.
This was supplemented by some work with the IFS, by Ian Crawford and Bella Image (the latter from ONS), that concluded that the COLI approach could (but should not) be adopted as a conceptual basis for the UK RPI.
A line was drawn in the sand when Image, a Prices methodologist, concluded that “there should be no more work on elementary aggregation until a decision has been reached on whether
GM may be used.
If so, it should be.
If not, RA (Dutot) should be used”.
In 2003 ONS switched the formula for 48 items, 47 of which were away from Carli to the ratio of averages.
Developments outside of ONS moved on, with the UK’s HICP being renamed the Consumer Prices
Index (CPI) and the Chancellor of the Exchequer’s Pre ‐ Budget Report 2003 announcing that the UK inflation target would in future be based on the CPI.
Within ONS, work was focussed on improving item descriptions to mitigate some of the impacts of the use of the Carli and in developing hedonic approaches to quality adjustment for a range of items.
Resources were allocated to work on the CPI, including participation in Eurostat led task forces.
The governance of RPI began to take a turn in 2004 when a Statistics Commission report recommended “that, in a revised Framework , the Chancellor should no longer be responsible for the scope and definition of the RPI but that these should instead be the responsibility of the National
Statistician, along with methodology.” At the same time, ONS began to look in earnest at the causes of the gap between RPI and CPI, and in particular began investigating the contribution to the gap being made by clothing items.
In 2005 an internal report revisited decisions and analyses set out in
2002, and again concluded that the Carli should not be used.
It identified weaknesses in the criteria for assessing the use of the Carli and proposed new measures.
It concluded that the formula effect was generating about 0.6
percentage points difference between the two.
However, there are no documents that show that a switch away from the Carli was seriously considered.
Outwardly, ONS reported on the conclusion of the three year work programme, begun 6 years earlier, but made little reference to the use of Carli.
Over the next couple of years work centred around the transfer of responsibilities for price statistics from London to Newport, and the expectation of a new computer system.
This was coincident with the creation of the UK Statistics Authority and issues around RPI were focussed on policy and governance rather than methodology.
The legal and policy issues were resolved in 2007 with the enactment of the Statistics and Registration Services Act, which established new arrangements for the governance of the RPI.
These placed responsibility with the Board to compile and maintain the
RPI and publish it each month.
It also required that the Board consult the Bank of England and
3
CONFIDENTIAL ‐ STATISTICS
ultimately the Chancellor before making any change to the coverage or the basic calculation of the index that was judged to be fundamental and materially detrimental to holders of index linked gilts.
The relocation of the consumer prices work was completed in 2007 and the RPI was first published from the Newport office in December of that year.
Around a year later, in January 2009, ONS discussed options for change to the RPI and CPI, including a review of formulae at a meeting with the Bank and HMT.
The minutes conclude that ONS’s “top priorities for change in the RPI and CPI in 2009” included the elementary aggregate formulae.
“Discussions followed regarding the shortcomings of the RPI in its current form, and it was acknowledged that the current statistical methodology was out of date and in need of review.
It was also noted that until RPI governance issues are resolved there would be barriers to change in the
CPI.” The Bank “pointed out that the MPC may be concerned if resources were diverted from the
CPI, to focus on updating the RPI and questioned the impact of introducing multiple changes to the
RPI.
“ The governance issues referred to previously were resolved in July 2009 with the formation of
CPAC and in December 2009 CPAC considered the issues taken to the Tripartite meeting between
ONS, HMT and the Bank at the start of the year.
This is the first time CPAC were asked to consider work to address the formula effect in development plans for the CPI and RPI.
However, including
OOH in the CPI was seen as the top priority and addressing the formula differences between CPI and
RPI was listed as an item for review in 2011 or later.
In early 2010 ONS implemented changes to the way prices for clothing were collected.
These changes were not brought to CPAC for approval but were discussed at the Tripartite meeting in
December 2009.
The question of whether the change was fundamental was considered by the meeting, but it was accepted that as this was a change to collection guidelines it was not.
The analysis of the impact of the change focussed on the CPI only, since the driver for the change was a compliance monitoring assessment by Eurostat in autumn 2008 and increasing concern from users for the continued and prolonged period during which inflation rates for clothing were negative.
There was no assessment of the impact the change might have on the formula effect.
After the changes to the collection guidelines were made, estimates of inflation in clothing in the CPI switched from negative to positive (so delivered the intended outcome) but the gap between CPI and RPI widened from around 0.5
percentage points to an average of 0.9
percentage points.
In late April
2010 the Authority’s Assessment Team began an assessment of consumer price statistics and progress on this was reported to CPAC in July.
At the same meeting, another update on the CPI and
RPI development plans was considered but the formula issues had slipped off the list.
CPAC accepted that a higher priority was attached to the need to continuously improve the CPI compared with the
RPI.
In part this probably reflected developments from the June Budget, where the Chancellor announced that the government would adopt the CPI for the indexation of benefits, tax credits and public service pensions.
In August 2010 the President of the RSS wrote to Sir Michael Scholar and expressed concerns around the widening formula effect.
CPAC was updated on these developments and a programme of work instigated, though it did not feature in the programme set out in CPAC’s annual report that was published in November 2010.
Indeed, CPAC first received a paper on the formula effect, though focussing on the clothing issues, at its meeting in May 2011, though development work within ONS was under way ahead of this date.
At the end of 2010 the Authority’s assessment of consumer prices noted that it is not always clear whether the different approaches that have been adopted in the
4
CONFIDENTIAL ‐ STATISTICS past for the RPI remain appropriate today.
For example, the use of the arithmetic mean to combine individual prices rather than the geometric mean.
The focus of investigation by ONS, under the guidance of CPAC has been to look at the clothing collection guideline changes in 2010.
However, that work was widened to look at the formulae used by other statistics offices, which showed that the UK was the only nation that retained the Carli.
The focus of the development programme therefore changed, and on the back of a significant amount of new research and analysis a tentative position has been reached on the formulae that are best suited for consumer inflation purposes.
There are a number of reasons why the time is now right to consider a change in elementary aggregate formula.
Strategies and tactics for pricing products have evolved over many years into various models which are now well documented in marketing literature.
Examples include loss leader pricing, predatory pricing and limit pricing.
In today’s supermarkets a range of items will be on offer at temporarily reduced price to attract customers, before returning to full price days, hours, or possibly minutes later.
The clothing industry has changed dramatically since the RRI was first published in 1956.
Ready ‐ made clothing using synthetic and easy ‐ care fabrics was a relatively new phenomenon in the 1950s.
A large segment of the fashion industry now relies on mass market sales, catering for as many customers as possible.
In order to save money and time, cheap fabrics and simpler production techniques are used which can easily be done by machine.
The final product can therefore be sold much more cheaply.
At the end of the season products are sold at dramatically reduced prices to make way for new stock.
These conditions create an environment where a variety of products are available at a range of prices for any one item in the CPI or RPI basket, making the items and prices more heterogeneous over time.
Products are frequently on and off sale, and in the case of clothing, items will need to be replaced by a comparable product if no longer available.
This is the type of everyday pricing behaviour which fuels a significant upward bias in the Carli formula.
It can be managed to a degree by refining item descriptions and comparability rules over time but is this not a means to an end.
The formula effect is now more important than ever before.
The rate of inflation in the UK abated substantially in the 1990’s.
As a result, a bias that might have contributed a fraction of the total annual change in prices is now a significant portion of the entire change.
In response to the CPI being used for the indexation of benefits, tax credits and public sector pensions there has been an increased focus on the formula effect from the public and other users.
Finally, empirical research by
ONS has shown that economic theory cannot be used to justify the use of the arithmetic mean or geometric mean based on simple models of consumer behaviour.
In addition, the theory is not applicable at the elementary aggregate level because, by their very definition, weighting information are not available at this level to test the theory.
These key findings have helped ONS build recommendations for change.
5
