Ch.2 Liquefaction
advertisement

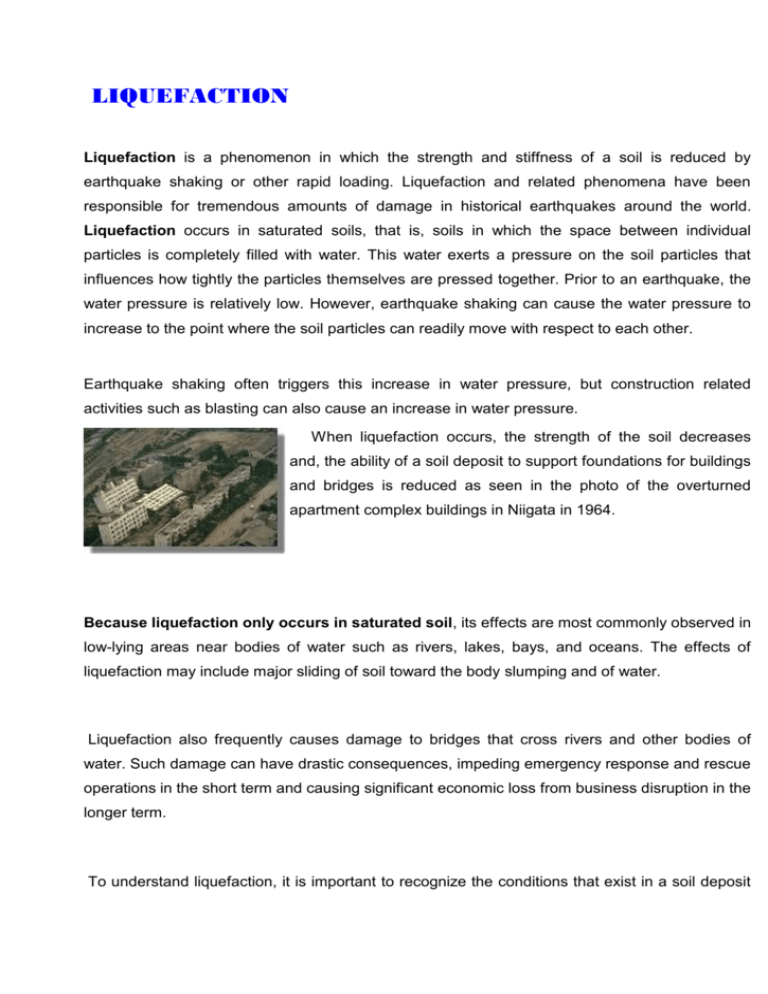
LIQUEFACTION Liquefaction is a phenomenon in which the strength and stiffness of a soil is reduced by earthquake shaking or other rapid loading. Liquefaction and related phenomena have been responsible for tremendous amounts of damage in historical earthquakes around the world. Liquefaction occurs in saturated soils, that is, soils in which the space between individual particles is completely filled with water. This water exerts a pressure on the soil particles that influences how tightly the particles themselves are pressed together. Prior to an earthquake, the water pressure is relatively low. However, earthquake shaking can cause the water pressure to increase to the point where the soil particles can readily move with respect to each other. Earthquake shaking often triggers this increase in water pressure, but construction related activities such as blasting can also cause an increase in water pressure. When liquefaction occurs, the strength of the soil decreases and, the ability of a soil deposit to support foundations for buildings and bridges is reduced as seen in the photo of the overturned apartment complex buildings in Niigata in 1964. Because liquefaction only occurs in saturated soil, its effects are most commonly observed in low-lying areas near bodies of water such as rivers, lakes, bays, and oceans. The effects of liquefaction may include major sliding of soil toward the body slumping and of water. Liquefaction also frequently causes damage to bridges that cross rivers and other bodies of water. Such damage can have drastic consequences, impeding emergency response and rescue operations in the short term and causing significant economic loss from business disruption in the longer term. To understand liquefaction, it is important to recognize the conditions that exist in a soil deposit before an earthquake. A soil deposit consists of an assemblage of individual soil particles. If we look closely at these particles, we can see that each particle is in contact with a number of neighboring particles. The weight of the overlying soil particles produce contact forces between the particles - these forces hold individual particles in place and give the soil its strength. Soil grains in a soil deposit. The height of the blue The length of the arrows represent the size of the contact column to the right represents the level of porewater forces between individual soil grains. The contact forces are pressure in the soil. large when the porewater pressure is low. Liquefaction occurs when the structure of a loose, saturated sand breaks down due to some rapidly applied loading. As the structure breaks down, the loosely-packed individual soil particles attempt to move into a denser configuration. In an earthquake, however, there is not enough time for the water in the pores of the soil to be squeezed out. Instead, the water is "trapped" and prevents the soil particles from moving closer together. This is accompanied by an increase in water pressure which reduces the contact forces between the individual soil particles, thereby softening and weakening the soil deposit. Observe how small the contact forces are because of the high water pressure. In an extreme case, the pore water pressure may become so high that many of the soil particles lose contact with each other. In such cases, the soil will have very little strength, and will behave more like a liquid than a solid - hence, the name "liquefaction". Critical Void Ratio In 1936, Dr. Arthur Casagrande performed a series of drained strain-controlled triaxial tests and discovered that initially loose and dense specimens at the same confining pressure approached the same density when sheared to large strains. The void ratio corresponding to this density was called the critical void ratio (ec). Behavior of dense and loose soils in monotonic strain controlled triaxial tests (after Kramer, 1996). Performing tests at various effective confining pressures, Casagrande found that the critical void ratio varied with effective confining pressure. Plotting these on a graph produced a curve which is referred to as the critical void ratio (CVR) line. The CVR line constituted the boundary between dilative and contractive behavior in drained triaxial compression. A soil in a state that plots above the CVR line exhibits contractive behavior and vice versa (see figure below). CVR-line for arithmetic and logarithmic confining pressure. Steady State of Deformation In the mid-1960s, Gonzalo Castro, a student of Casagrande, performed an important series of undrained, stress-controlled triaxial tests. Castro observed three different types of stress-strain behavior depending upon the soil state. Dense specimens initially contracted but then dilated with increasing effective confining pressure and shear stress. Very loose samples collapsed at a small shear strain level and failed rapidly with large strains. Castro called this behavior "liquefaction" - it is also commonly referred to as flow liquefaction. Medium dense soils initially showed the same behavior as the loose samples but, after initially exhibiting contractive behavior, the soil "transformed" and began exhibiting dilative behavior. Castro referred to this type of behavior as "limited liquefaction". Static triaxial test stress paths for three specimens of different densities. Castro plotted the relationship (see figure below) between effective confining pressure and void ratio at large strains for these undrained, stress-controlled tests. Castro referred to the curved produced by this plot, which is similar to the CVR line for the drained strain controlled tests performed by Casagrande, as the Steady State Line (SSL). The difference between the CVR and SSL was attributed to the existence of what Casagrande called a "flow structure", in which the grains orient themselves so the least amount of energy is lost by frictional resistance during flow. Left: 3-D steady state line. Right: 2-D Projection of SSL plotted on graph of void ratio versus the logarithm of confining pressure or steady state strength. As seen above, the SSL is actually a 3-dimensional curve in e- - -D projection on the eliquefaction. Soils in an initial state that plots below the SSL are not susceptible to flow liquefaction whereas soils plotting above the SSL are susceptible to flow liquefaction - if (and only if) the static shear stress exceeds the residual strength of the soil. Cyclic mobility, another liquefaction-related phenomenon, can occur in dense as well as loose soils. Figure showing zones of flow liquefaction and cyclic mobility susceptibility. Flow Liquefaction Flow liquefaction is a phenomenon in which the static equilibrium is destroyed by static or dynamic loads in a soil deposit with low residual strength. Residual strength is the strength of a liquefied soil. Static loading, for example, can be applied by new buildings on a slope that exert additional forces on the soil beneath the foundations. Earthquakes, blasting, and pile driving are all example of dynamic loads that could trigger flow liquefaction. Once triggered, the strength of a soil susceptible to flow liquefaction is no longer sufficient to withstand the static stresses that were acting on the soil before the disturbance. On the left below is a plot of stress paths for five undrained shear tests. Three test specimens (C, D, and E) were subjected to loads greater than their residual strengths, and experienced flow liquefaction. A straight line (shown in red in the figure) drawn through the points where flow liquefaction was initiated projects back through the origin. This line is called the Flow Liquefaction Surface (FLS). Since flow liquefaction cannot take place if the static shear stress is lower than the steady state strength, the FLS is truncated by a horizontal line through the steady state point (see right figure below).The steady state strength is the strength a soil has when undergoing a steady state of deformation, i.e. continuous flow under constant shear stress and constant effective confining pressure at constant volume and constant velocity. Flow liquefaction will be initiated if the stress path crosses the FLS during undrained shear regardless of whether the loading is cyclic or monotonic loading ( Vaid and Chern, 1983). Graphical explanation of Flow Liquefaction Surface. The stress paths for monotonic and cyclic loading can be seen below. The flow liquefaction process can be described in two stages. First, the excess pore pressure that develops at low strains moves the effective stress path to the FLS, at which point the soil becomes unstable. When the soil reaches this point of instability under undrained conditions, its shear strength drops to the residual strength. As a result the static shear stresses drive the large strains that develop as the soil "collapses". A great amount of strain-softening takes place when the stress path moves toward the steady state point. Flow Failure induced by cyclic and monotonic loading. Cyclic Mobility Cyclic mobility is a liquefaction phenomenon, triggered by cyclic loading, occurring in soil deposits with static shear stresses lower than the soil strength. Deformations due to cyclic mobility develop incrementally because of static and dynamic stresses that exist during an earthquake. Cyclic mobility can occur even when the static shear stress is lower than the steady state (or residual) shear strength. A key to this understanding came about with identification of the phase transformation line. Medium dense to dense sands subjected to monotonic loading will initially exhibit contractive behavior, but then exhibit dilative behavior as they strain toward the steady state. A plot of the stress path points at which the transformation from contractive to dilative behavior takes place reveals a phase transformation line (PTL) that appears to project back through the origin (Ishihara, 1985). A p'-q plot of the phase transformation line In the contractive region, an undrained stress path will tend to move to the left as the tendency for contraction causes pore pressure to increase and p' to decrease. As the stress path approaches the PTL, the tendency for contraction reduces and the stress path becomes more vertical. When the stress path reaches the PTL, there is no tendency for contraction or dilation, hence p' is constant and the stress path is vertical. After the stress path crosses the PTL, the tendency for dilation causes the pore pressure to decrease and p' to increase, and the stress path moves to the right. A stress path example. Note that, because the stiffness of the soil depends on p', the stiffness decreases (while the stress path is below the PTL) but then increases (when the stress path moves above the PTL). This change in stiffness produces the "limited liquefaction" behavior originally noted by Castro. Under cyclic loading conditions, the behavior becomes even more complex. Remembering that the failure envelope and PTL exist for negative shear stresses as well as positive, it is easy to see that a cyclically loaded soil can undergo the contraction/dilation transformation in two different directions. The stress-strain and stress path plots for a harmonically loaded element of soil will therefore show softening behavior in the early stages of loading (before the stress path has reached the PTL) but then show cyclic softening and hardening as the stress path moves from one side of the PTL to the other. The result of the phase transformation behavior is reflected in the development of "banana-shaped" stress-strain loops. Evaluation of Liquefaction Potential Evaluation of the potential for liquefaction to occur is accomplished by comparing equivalent measures of earthquake loading and liquefaction resistance. The most common approach to characterization of earthquake loading is through the use of cyclic shear stresses. By normalizing the cyclic shear stress amplitude by the initial effective vertical stress, a cyclic stress ratio (CSR) can represent the level of loading induced at different depths in a soil profile by an earthquake. There are different procedures for evaluating the cyclic shear stresses - site response analyses may be performed or a "simplified" approach may be used to estimate CSR as a function of peak ground surface acceleration amplitude. [ CSR versus N or qc Liquefaction resistance is most commonly characterized on the basis of observed field performance. Detailed investigation of actual earthquake case histories has allowed determination of the combinations of insitu properties (usually SPT or CPT resistance) and CSR for each case history. By plotting the CSR-(N1)60 (or CSR-qc) pairs for cases in which liquefaction was and was not been observed, a curve that bounds the conditions at which liquefaction has historically been observed can be drawn. This curve, when interpreted as the maximum CSR for which liquefaction of a soil with a given penetration resistance can resist liquefaction, can be thought of as a curve of cyclic resistance ratio (CRR). Then, the potential for liquefaction can be evaluated by comparing the earthquake loading (CSR) with the liquefaction resistance (CRR) - this is usually expressed as a factor of safety against liquefaction, FS = CRR / CSR A factor of safety greater than one indicates that the liquefaction resistance exceeds the earthquake loading, and therefore that liquefaction would not be expected. There are basically three possibilities to reduce liquefaction hazards when designing and constructing new buildings or other structures as bridges, tunnels, and roads. Avoid Liquefaction Susceptible Soils The first possibility, is to avoid construction on liquefaction susceptible soils. There are various criteria to determine the liquefaction susceptibility of a soil. By characterizing the soil at a particular building site according to these criteria one can decide if the site is susceptible to liquefaction and therefore unsuitable for the desired structure. Learn more about liquefaction susceptibility. Build Liquefaction Resistant Structures If it is necessary to construct on liquefaction susceptible soil because of space restrictions, favorable location, or other reasons, it may be possible to make the structure liquefaction resistant by designing the foundation elements to resist the effects of liquefaction. Learn more about design of liquefaction resistant structures. Improve the Soil The third option involves mitigation of the liquefaction hazards by improving the strength, density, and/or drainage characteristics of the soil.


