jcb_23107_sm_SuppData
advertisement
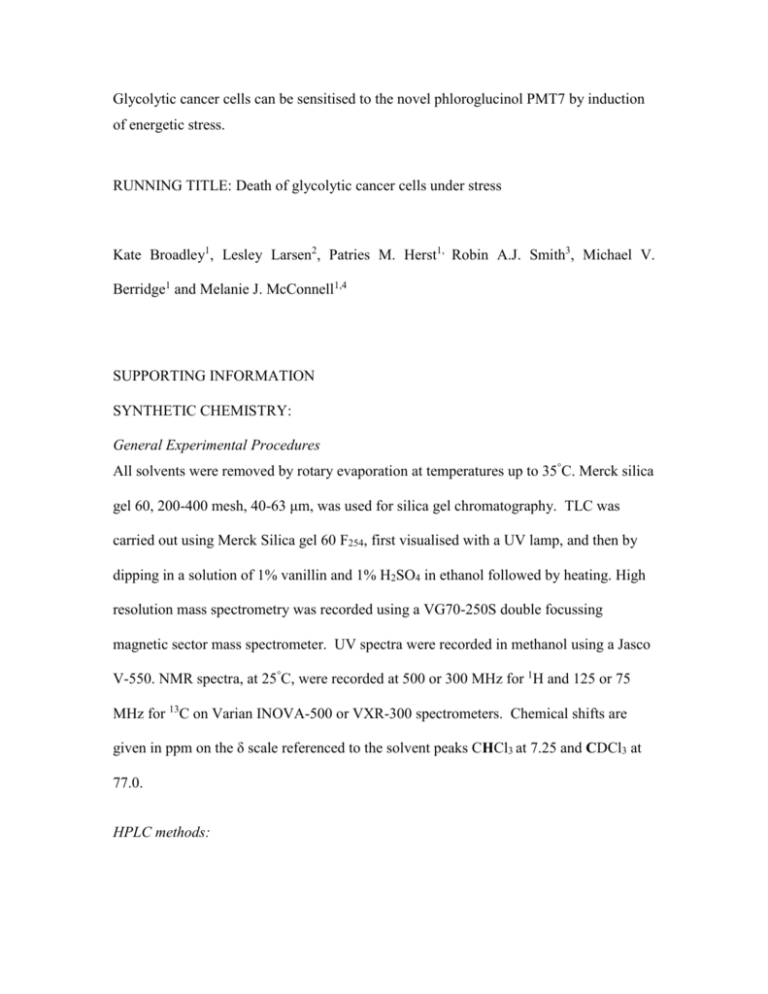
Glycolytic cancer cells can be sensitised to the novel phloroglucinol PMT7 by induction of energetic stress. RUNNING TITLE: Death of glycolytic cancer cells under stress Kate Broadley1, Lesley Larsen2, Patries M. Herst1, Robin A.J. Smith3, Michael V. Berridge1 and Melanie J. McConnell1,4 SUPPORTING INFORMATION SYNTHETIC CHEMISTRY: General Experimental Procedures All solvents were removed by rotary evaporation at temperatures up to 35°C. Merck silica gel 60, 200-400 mesh, 40-63 μm, was used for silica gel chromatography. TLC was carried out using Merck Silica gel 60 F254, first visualised with a UV lamp, and then by dipping in a solution of 1% vanillin and 1% H2SO4 in ethanol followed by heating. High resolution mass spectrometry was recorded using a VG70-250S double focussing magnetic sector mass spectrometer. UV spectra were recorded in methanol using a Jasco V-550. NMR spectra, at 25°C, were recorded at 500 or 300 MHz for 1H and 125 or 75 MHz for 13C on Varian INOVA-500 or VXR-300 spectrometers. Chemical shifts are given in ppm on the δ scale referenced to the solvent peaks CHCl3 at 7.25 and CDCl3 at 77.0. HPLC methods: Method A: HPLC analysis was carried out using an Agilent HP1100 at 25 °C on a C18 column (Phenomenex Luna ODS(3) 5 μm 100 A 150 x 3 mm) with a 2 x 4 mm C18 guard column. Peaks were detected at 210 and 254 nm and UV spectra recorded from 190 to 600 nm. The mobile phase was acetonitrile in water, both with 0.1% formic acid: t0=10%, t12.5=100%, t15=100%, t16=10%, t20=10%. The flow rate was 0.5 mL/min, with an injection volume of 5 L. Method B: HPLC analysis was carried out using an Agilent HP1100 at 25 °C on a C8 column (Agilent Zorbax Eclipse XDB-C8 5 μm 100 A 150 x 4.6 mm) with a 2 x 4 mm C8 guard column. Peaks were detected at 210 and 254 nm and UV spectra recorded from 190 to 600 nm. The mobile phase was methanol in water, both with 0.1% trifluoroacetic acid: t0=10%, t12.5=100%, t15=100%, t16=10%, t20=10%. The flow rate was 0.5 mL/min, with an injection volume of 5 L. 1,4-bis(benzyloxy)-2-(10-hydroxydecyl)-5,6-dimethoxy-3-methylbenzene (1) Yield 9.3g, 83%. Anal. calcd. for C33H44O5 : C, 76.1; H, 8.5; Found: C, 76.2; H, 8.4%. 1 H NMR (CDCl3) 7.30-7.55 (10H, m, PhH), 5.00 (2H, s, CH2Ph), 4.96 (2H, s, CH2Ph), 3.95 (3H, s, OCH3), 3.94 (3H, s, OCH3), 3.63 (2H, t, J=6.5Hz, CH2-OH), 2.57 (2H, t, J = 8.5 Hz, CH2Ar), 2.15 (3H, s, ArCH3), 1.40-1.20 (16H, m) ppm. 1,4-bis(benzyloxy)-2-(10-iododecyl)-5,6-dimethoxy-3-methylbenzene (2). Yield 1.43 g, 79%. MS found 653.2111; C33H43IO4.Na requires 653.2098. 1 H NMR (CDCl3) 7.48 (4H, bd, PhH), 7.39 (4H, bt, PhH ), 7.34 (2H, m PhH, ), 4.99 (2H, s, CH2Ph), 4.94 (2H, s, CH2Ph), 3.94 (3H, s, OCH3), 3.93 (3H, s, OCH3), 3.18 (2H, t, J= 8Hz, CH2I), 2.58 (2H, m, ArCH2), 2.13 (3H, s, ArCH3), 1.80 (2H, m, CH2 CH2I) and 1.24 – 1.43 (14H, m) ppm. 2-(10-(2,5-bis(benzyloxy)-3,4-dimethoxy-6-methylphenyl)decyl)benzene-1,3,5-triol (3). Yield 125 mg, 31%. HPLC 16.01 minutes (Method A), 16.47 minutes (Method B). MS found 651.3292; C39H48O7.Na requires 651.3292. 1 H NMR (CDCl3) 7.48 (4H, bd, PhH), 7.39 (4H, bt, PhH ), 7.34 (2H, m, PhH ), 5.85 (2H, s, ArH), 4.99 (2H, s, CH2Ph ), 4.95 (2H, s, CH2Ph), 3.94 (3H, s, O CH3), 3.93 (3H, s, O CH3), 2.55 (2H, m), 2.49 (2H, t, J 8Hz, CH2Ar), 2.13 (3H, s, ArCH3), 1.48 (2H, m), 1.39 (2H, m) and 1.24 – 1.31 (12H, m) ppm. 13 C NMR (CDCl3) 155.21 (2C), 154.47, 146.74, 146.61, 144.86, 144.79, 138.00, 137.79, 130.86, 128.42 (4C), 128.27 (2C), 127.94 (3C), 127.85, 125.52, 107.74, 95.63 (2C), 75.39, 75.11, 61.31, 61.29, 30.06, 29.86, 29.39, 29.35 (2C), 29.33, 29.29, 29.22, 27.22, 22.61 and 12.03 ppm. I.R. max 3391, 2926, 2854, 1620, 1465, 1370 and 1105 cm-1. UV max log 280 (3.50) nm. 2-(10-(2,4,6-trihydroxyphenyl)decyl)-5,6-dimethoxy-3-methyl-2,5-cyclohexadiene-1,4dione (PMT7) Yield 32 mg, 90%. HPLC 12.40 minutes (Method A), 14.38 (Method B). MS found 469.22201; C25H34O7.Na requires 469.21967. 1 H NMR (CDCl3) 6.04 (1H, 2xOH), 5.95 (2H, s, ArH), 5.78 (2H, OH), 3.94 (6H, s, 2xOCH3), 2.48 (2H, bs, CH2Ar), 2.40 (2H, m, CH2Ar), 1.97 (3H, s, quinoneCH3), 1.45 (2H, bs) and 1.24 – 1.31 (14H, m) ppm. 13 C NMR (CDCl3) 184.93, 184.56, 155.38 (2C), 154.32 , 144.22, 143.24, 138.94, 108.24, 95.72 (2C), 61.18 (2C), 29.67, 29.58, 29.38, 29.26 (3C), 29.14, 29.08, 28.55, 26.35, 22.65 and 11.92 ppm. IR max 3412, 2926, 2854, 1643, 1620, 1456, 1267 cm-1. UV max log 277 (4.02) nm. OBn MeO MeO OH OBn 1 a OBn OH MeO + MeO I OBn HO 2 OH b OBn MeO OH MeO OBn 3 HO OH c O MeO OH MeO O Scheme 1. PMT7 HO OH Synthesis of PMT7. a, i, MsCl, Et3N; ii, NaI, CH3CN. b, KOH, MeOH. c, H2, 5% Pd/C. Supplemental Figure 1: Reliance on mitochondrial electron transport is measured by the effect of mitochondrial uncoupling on NADH flux, as determined by WTS1/PMS reduction after FCCP treatment (Herst PM, Berridge MV. Cell surface oxygen consumption: a major contributor to cellular oxygen consumption in glycolytic cancer cell lines. Biochim Biophys Acta 2007 Feb; 1767 (2): 170-177). Cells were incubated with 2 M FCCP and WST1/PMS reduction was measured as described in the main text.
