Plant competition lab - MYP
advertisement
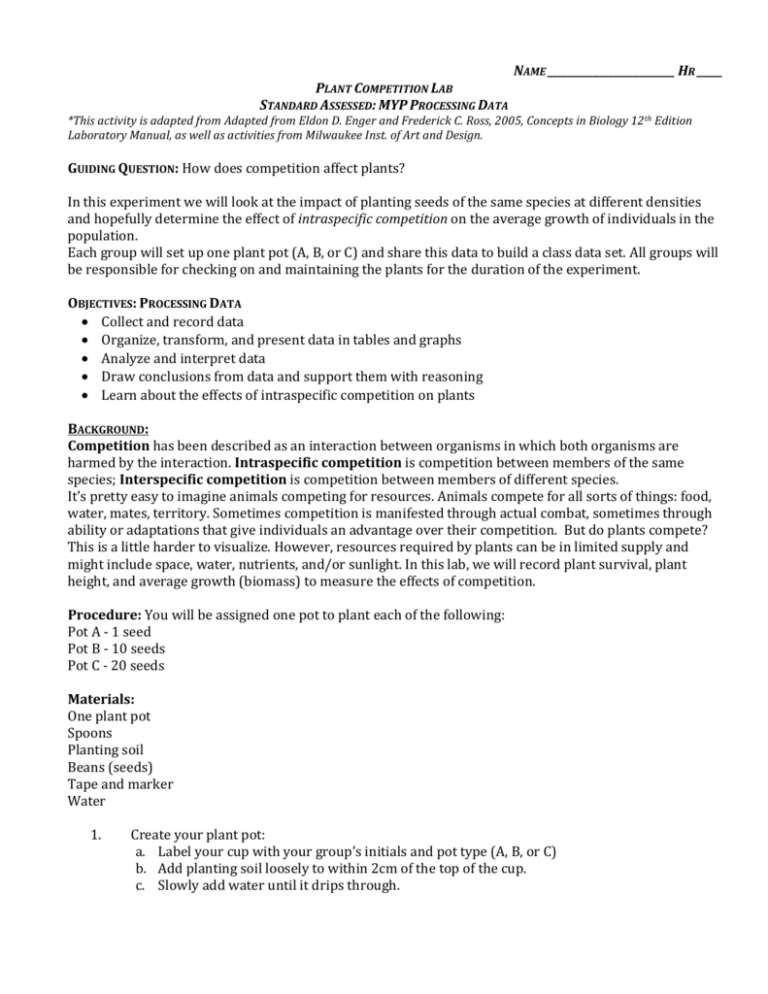
NAME _________________________ HR _____ PLANT COMPETITION LAB STANDARD ASSESSED: MYP PROCESSING DATA *This activity is adapted from Adapted from Eldon D. Enger and Frederick C. Ross, 2005, Concepts in Biology 12 th Edition Laboratory Manual, as well as activities from Milwaukee Inst. of Art and Design. GUIDING QUESTION: How does competition affect plants? In this experiment we will look at the impact of planting seeds of the same species at different densities and hopefully determine the effect of intraspecific competition on the average growth of individuals in the population. Each group will set up one plant pot (A, B, or C) and share this data to build a class data set. All groups will be responsible for checking on and maintaining the plants for the duration of the experiment. OBJECTIVES: PROCESSING DATA Collect and record data Organize, transform, and present data in tables and graphs Analyze and interpret data Draw conclusions from data and support them with reasoning Learn about the effects of intraspecific competition on plants BACKGROUND: Competition has been described as an interaction between organisms in which both organisms are harmed by the interaction. Intraspecific competition is competition between members of the same species; Interspecific competition is competition between members of different species. It’s pretty easy to imagine animals competing for resources. Animals compete for all sorts of things: food, water, mates, territory. Sometimes competition is manifested through actual combat, sometimes through ability or adaptations that give individuals an advantage over their competition. But do plants compete? This is a little harder to visualize. However, resources required by plants can be in limited supply and might include space, water, nutrients, and/or sunlight. In this lab, we will record plant survival, plant height, and average growth (biomass) to measure the effects of competition. Procedure: You will be assigned one pot to plant each of the following: Pot A - 1 seed Pot B - 10 seeds Pot C - 20 seeds Materials: One plant pot Spoons Planting soil Beans (seeds) Tape and marker Water 1. Create your plant pot: a. Label your cup with your group’s initials and pot type (A, B, or C) b. Add planting soil loosely to within 2cm of the top of the cup. c. Slowly add water until it drips through. 2. 3. 4. 5. Plant your bean seeds: a. Obtain the correct number of bean seeds. b. Place the seeds on the surface of the soil. c. Gently cover the seeds with a thin layer of soil. Place on the tray on the teacher lab table. The pots will be placed in a warm, well-lighted area (under grow lights). Examine the plants daily and add slowly add a little water when the surface of the soil is dry. Record observations daily and collect data on the last day. Data Collection Procedure Collect data including plant survival, height, and biomass (the weight of the biological material) for each pot: 1. Carefully invert the pot containing the plants over a newspaper/tray and gently remove the soil from the plants in the pot. Dipping them gently in water may enable you to remove more of the sand without breaking off roots. The goal is to remove the soil but not break the plants! Pat them dry with paper towels. 2. Count and record the number of plants that survived in each pot. 3. Calculate the percent of surviving plants: Number of surviving plants Number planted 4. 5. Measure the height of each plant from the base of the stem to the highest point in cm and record. Calculate and record the average height. Sum of all heights number of plants 6. 7. = % surviving = average height Carefully measure and record the mass of all of the plants, including all parts of the plants: roots, stems, leaves. Calculate and record the average biomass. Total biomass = average biomass number of plants 8. Share your data with the class by completing the data table on the board or overhead. Data Table 1: Group Data Number seeds/ pot Total # of surviving plants % Surviving plants Heights of all plants Average height (cm) Total biomass Average biomass (g) Data Table 2: Class Data Pot A Number seeds/ pot 1 1 1 1 1 1 B 10 10 10 10 10 10 C 20 20 20 20 20 20 % Surviving plants Average height (cm) Average biomass (g) Questions: Discuss these questions with your table group and record your initial thoughts. Did population density affect percent survival? Average height? Average biomass? Was there evidence of intraspecific competition? Can you explain this? What resources may have been limiting? INDIVIDUAL PLANNING WORKSHEET Choose one focus question. Circle/highlight your choice: How does population density affect plant survival? How does population density affect plant height? How does population density affect plant biomass? Identify your independent and dependent variables: Independent variable: _____________________________________________________________________________________ Dependent variable: _______________________________________________________________________________________ Form a hypothesis related to your focus question. Try to use the “If…then” format. Hypothesis: _________________________________________________________________________________________________ ________________________________________________________________________________________________________________ Decide which data will help test your hypothesis. You will not need to use all of the data. Circle/highlight the appropriate columns in the class data table. Record the data you plan to use below. Plan how you might process the data (work with it mathematically). Record your ideas below. Plan how you might present the data in a graph that will show the relationship between the two variables you are investigating. Record/sketch your ideas below. Results and Analysis Process the data related to your hypothesis and complete any planned calculations. Graph the data. Graph1 : ________________________________________ Graph 2 (if needed):______________________________ ____________________________________________________ ______________________________________________________ Conclusions 1. What is your interpretation of the data? Describe any trends, patterns or relationships. ______________________________________________________________________________________________________ ______________________________________________________________________________________________________ ______________________________________________________________________________________________________ 2. What conclusions do you draw from your interpretation? Do your results support or reject your hypothesis? Give evidence. ______________________________________________________________________________________________________ ______________________________________________________________________________________________________ ______________________________________________________________________________________________________ 3. Why do your results make sense in scientific terms (explain based on plant competition, adaptations and resource use)? Could these results be useful to you/humankind/the world? ______________________________________________________________________________________________________ ______________________________________________________________________________________________________ ______________________________________________________________________________________________________ ______________________________________________________________________________________________________ 4. How reliable do you think the data is? Explain based on sources of error, measurements and instruments used, sample size, etc. ______________________________________________________________________________________________________ ______________________________________________________________________________________________________ 5. How would you design this experiment differently? If you were going to continue along this line of research, what would you do next? ______________________________________________________________________________________________________ ______________________________________________________________________________________________________ Lab Mini-Poster Create a mini-poster (on regular or legal size paper) that summarizes your investigation. Use the template below to help you design your poster. Question: What question did you investigate? Independent variable: What variable did you change? Dependent variable: What variable did you measure? (Include units.) Hypothesis: What hypothesis were you testing? (Write in “If…then, when….” Format.) Results and Analysis: Present your data in a clearly labeled table or graph. Describe any trends, patterns, or relationships in the data. Discuss the reliability of the data. Conclusion: State your conclusion and explain using evidence. You will share your poster with classmates and get feedback on your work. Based on this feedback, make your revisions, and turn in a final copy (poster-sized or 8.5 x 11) for your evidence grade. You will be assessed using the rubric below. Criterion E: Processing Data Achievement level 0 Level descriptor The student does not reach a standard described by any of the descriptors below. 1–2 The student collects some data and attempts to record it in a suitable format. The student organizes and presents data using simple numerical or visual forms. The student attempts to identify a trend, pattern or relationship in the data. The student attempts to draw a conclusion, but this is not consistent with the interpretation of the data. 3–4 The student collects sufficient relevant data and records it in a suitable format. The student organizes, transforms and presents data in numerical and/or visual forms, with a few errors or omissions. The student states a trend, pattern or relationship shown in the data. The student draws a conclusion consistent with the interpretation of the data. 5–6 The student collects sufficient relevant data and records it in a suitable format. The student organizes, transforms and presents data in numerical and/or visual forms logically and correctly. The student describes a trend, pattern or relationship in the data and comments on the reliability of the data. The student draws a clear conclusion based on the correct interpretation of the data and explains it using scientific reasoning.
