LAB 3: TOPOGRAPHIC MAPS
advertisement

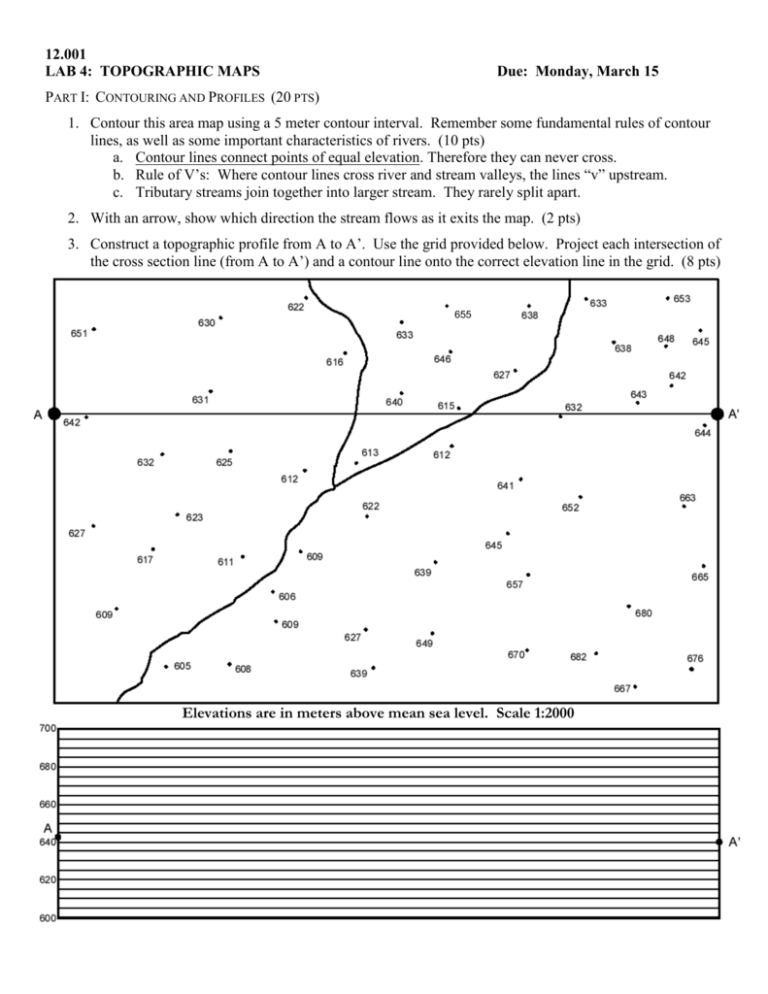
12.001 LAB 4: TOPOGRAPHIC MAPS Due: Monday, March 15 PART I: CONTOURING AND PROFILES (20 PTS) 1. Contour this area map using a 5 meter contour interval. Remember some fundamental rules of contour lines, as well as some important characteristics of rivers. (10 pts) a. Contour lines connect points of equal elevation. Therefore they can never cross. b. Rule of V’s: Where contour lines cross river and stream valleys, the lines “v” upstream. c. Tributary streams join together into larger stream. They rarely split apart. 2. With an arrow, show which direction the stream flows as it exits the map. (2 pts) 3. Construct a topographic profile from A to A’. Use the grid provided below. Project each intersection of the cross section line (from A to A’) and a contour line onto the correct elevation line in the grid. (8 pts) 655 Elevations are in meters above mean sea level. Scale 1:2000 PART II: TRIBUTARIES AND DRAINAGE DIVIDES (20 PTS) The topographic map on this page is adapted from a real map near the town of Ellington, in north-central Connecticut. Several valleys which have streams in them (not marked on the map), empty from the interior of the map outward towards the edges. Each has a drainage basin, separated from the drainage basins of the adjacent stream by divides. 1. Identify the streams that flow across the borders of the map area. Starting at the northeastern corner of the map and proceeding clockwise around the edges, number these streams sequentially. (6 pts) 2. With blue colored pencil, trace the course of each stream, including all tributary valleys, to the place where the valley is no longer well defined by the topography. (7 pts) 3. With solid red lines, trace the positions of the divides between each of the main streams identified in question 1. (7 pts) Page 2 of 6 PART III: LOOKING AT REAL TOPOGRAPHIC AND RAISED RELIEF MAPS (40 PTS, 2 PTS EACH) Answer the following questions using the topographic maps and raised relief maps arranged around the room. Answers should be given in meters and be sure to include units when you write your answer. FURNACE CREEK, CA (1 MAP): 1. What is the scale and contour interval of this map? 2. Estimate the lowest and highest elevations on this map. 3. Describe what you would see and how the landscape would change if you were to walk along the Echo Canyon stream starting in the NE and walking to the SW. Are you walking upstream or downstream? Assume that your path goes to the south at the Furnace Creek Inn. (Bonus: why does the stream bifurcate here? This is very unusual stream behavior!) OOLITIC, IN (1 MAP): 4. What is the scale and contour interval of this map? 5. How are closed depressions indicated on this map? 6. What is the origin of the closed depressions, especially those just west of the town of Oolitic? Remember what kind of rocks are oolitic! 7. What 1:24000 quadrangle is west of Oolitic?________________________________________________ SOUTHWEST HARBOR, ME (ACADIA NATIONAL PARK, 1 MAP): 8. What is the scale and contour interval of this map? 9. What is the bathymetric (underwater) contour interval? Are you sure? ___________________________ ____________________________________________________________________________________ 10. What is the tidal range?_________________________________________________________________ 11. If glaciers usually form U-shaped valleys and river usually form V-shaped valleys (in cross section), which has been primarily responsible for shaping this landscape? Page 3 of 6 SOUTH PASS, LA (2 MAPS): 12. What is the scale and contour interval of this map? 13. Why are there no contour lines on this map? 14. What is the tidal range?________________________________________________________________ 15. This quadrangle is part of the delta of what river?____________________________________________ 16. We have 2 editions of maps for this quadrangle. What years were they released, and what kind of image was used for the earlier edition?__________________________________________________________ ____________________________________________________________________________________ 17. On the earlier edition map: How far apart is the fresh water reservoir from the waste water disposal area? What would happen in a storm surge? [Storm surge is water pushed toward shore by very large storms, especially hurricanes. 9 out of 10 people killed in hurricanes in the U.S. die from the storm surge] ______________________________________________________________________________ ____________________________________________________________________________________ CRATER LAKE, OR (5 MAPS): 18. What is the scale and contour interval of each of the four maps with scales? 19. What is the elevation difference in meters between the highest point in the crater rim and the lake surface? What is the slope in degrees (you might use trigonometry to calculate this)? 20. What is the approximate azimuthal sun angle in the shaded relief map? Page 4 of 6 DEMs: Digital Elevation Models The following pages show data from Mt Holmes quadrangle, Utah. Mt Holmes is one of the five Henry Mountains, in southeast Utah. This was the last mountain range to be named in the continental United States. The figure represents the same size area as a USGS 1:24000 quad (7.5 minutes). 1. DEM cross sections (10 points): Pictured are 3 cross-sections of the topography of Mt Holmes quadrangle. Calculate the vertical exaggeration of the second profile. The DEM has lettered lines that correspond to the cross sections. Match the letter to the cross section. Profile letter:__________ Profile letter:__________ Vertical exaggeration:___ _____________________ Profile letter:___________ Page 5 of 6 2. Find the channels (10 points): On the DEM, draw the locations of the major stream channels and their tributaries. On each channel, draw the direction of current flow. Light colors represent higher elevations, dark are lower elevations. Page 6 of 6


