What level of exposure to Tacrolimus prevents acute rejection
advertisement
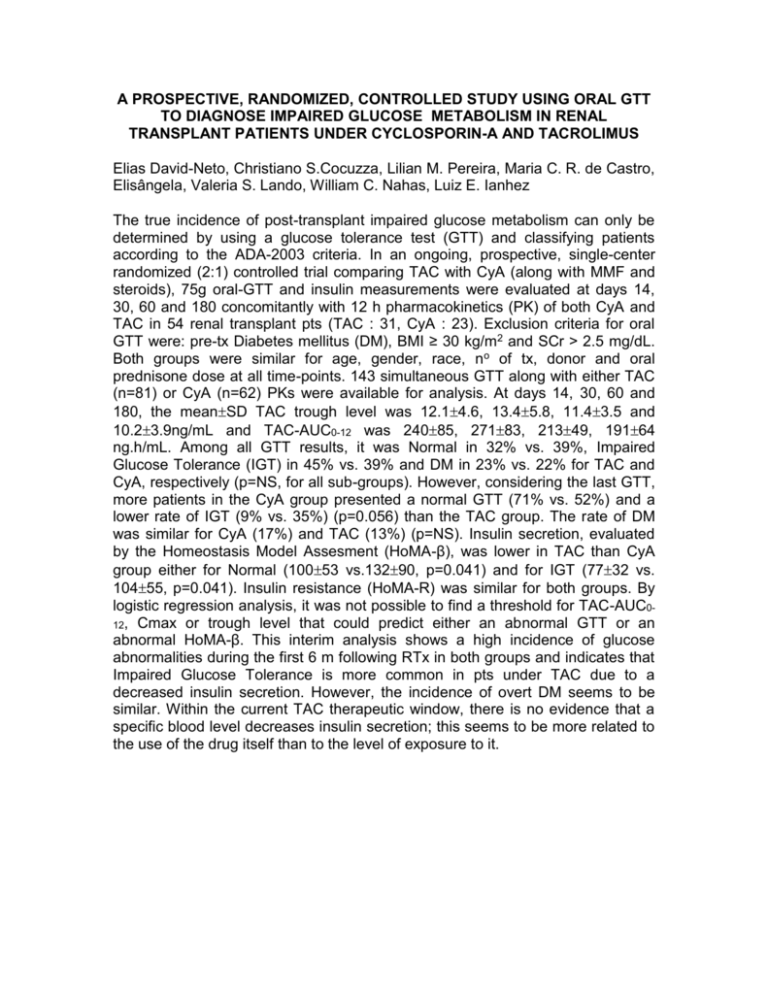
A PROSPECTIVE, RANDOMIZED, CONTROLLED STUDY USING ORAL GTT TO DIAGNOSE IMPAIRED GLUCOSE METABOLISM IN RENAL TRANSPLANT PATIENTS UNDER CYCLOSPORIN-A AND TACROLIMUS Elias David-Neto, Christiano S.Cocuzza, Lilian M. Pereira, Maria C. R. de Castro, Elisângela, Valeria S. Lando, William C. Nahas, Luiz E. Ianhez The true incidence of post-transplant impaired glucose metabolism can only be determined by using a glucose tolerance test (GTT) and classifying patients according to the ADA-2003 criteria. In an ongoing, prospective, single-center randomized (2:1) controlled trial comparing TAC with CyA (along with MMF and steroids), 75g oral-GTT and insulin measurements were evaluated at days 14, 30, 60 and 180 concomitantly with 12 h pharmacokinetics (PK) of both CyA and TAC in 54 renal transplant pts (TAC : 31, CyA : 23). Exclusion criteria for oral GTT were: pre-tx Diabetes mellitus (DM), BMI ≥ 30 kg/m2 and SCr > 2.5 mg/dL. Both groups were similar for age, gender, race, no of tx, donor and oral prednisone dose at all time-points. 143 simultaneous GTT along with either TAC (n=81) or CyA (n=62) PKs were available for analysis. At days 14, 30, 60 and 180, the meanSD TAC trough level was 12.14.6, 13.45.8, 11.43.5 and 10.23.9ng/mL and TAC-AUC0-12 was 24085, 27183, 21349, 19164 ng.h/mL. Among all GTT results, it was Normal in 32% vs. 39%, Impaired Glucose Tolerance (IGT) in 45% vs. 39% and DM in 23% vs. 22% for TAC and CyA, respectively (p=NS, for all sub-groups). However, considering the last GTT, more patients in the CyA group presented a normal GTT (71% vs. 52%) and a lower rate of IGT (9% vs. 35%) (p=0.056) than the TAC group. The rate of DM was similar for CyA (17%) and TAC (13%) (p=NS). Insulin secretion, evaluated by the Homeostasis Model Assesment (HoMA-β), was lower in TAC than CyA group either for Normal (10053 vs.13290, p=0.041) and for IGT (7732 vs. 10455, p=0.041). Insulin resistance (HoMA-R) was similar for both groups. By logistic regression analysis, it was not possible to find a threshold for TAC-AUC012, Cmax or trough level that could predict either an abnormal GTT or an abnormal HoMA-β. This interim analysis shows a high incidence of glucose abnormalities during the first 6 m following RTx in both groups and indicates that Impaired Glucose Tolerance is more common in pts under TAC due to a decreased insulin secretion. However, the incidence of overt DM seems to be similar. Within the current TAC therapeutic window, there is no evidence that a specific blood level decreases insulin secretion; this seems to be more related to the use of the drug itself than to the level of exposure to it.
