5.6 Connecting Variation, Slope and First Differences
advertisement
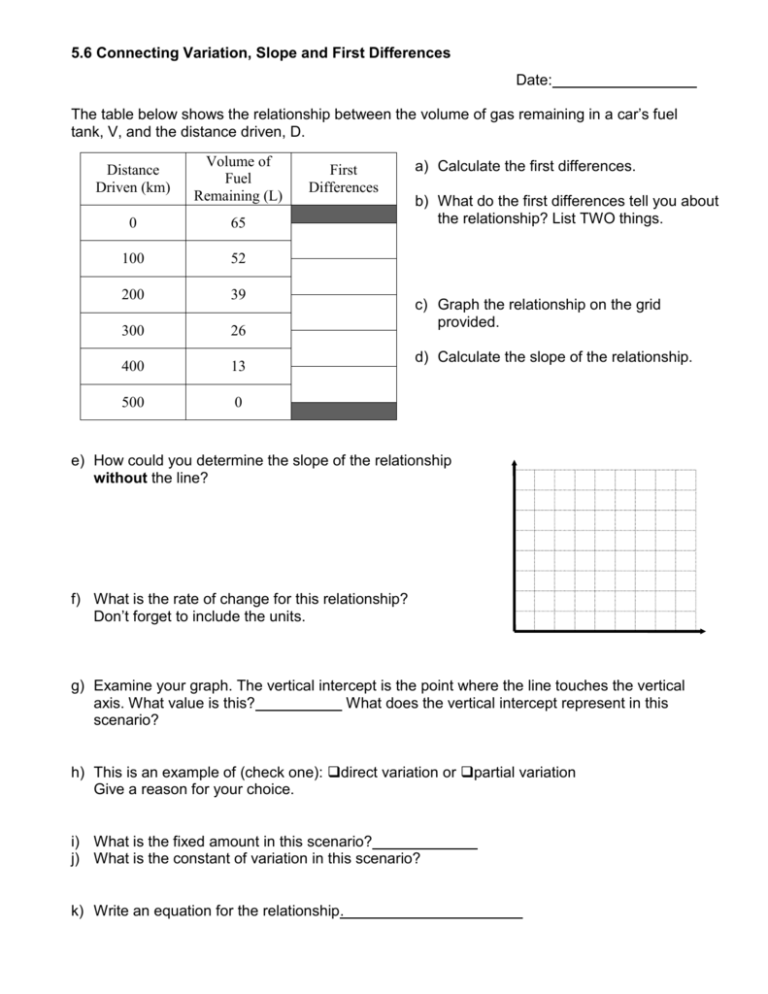
5.6 Connecting Variation, Slope and First Differences Date: The table below shows the relationship between the volume of gas remaining in a car’s fuel tank, V, and the distance driven, D. Distance Driven (km) Volume of Fuel Remaining (L) 0 65 100 52 200 39 300 26 400 13 500 0 First Differences a) Calculate the first differences. b) What do the first differences tell you about the relationship? List TWO things. c) Graph the relationship on the grid provided. d) Calculate the slope of the relationship. e) How could you determine the slope of the relationship without the line? f) What is the rate of change for this relationship? Don’t forget to include the units. g) Examine your graph. The vertical intercept is the point where the line touches the vertical axis. What value is this? What does the vertical intercept represent in this scenario? h) This is an example of (check one): direct variation or partial variation Give a reason for your choice. i) What is the fixed amount in this scenario? j) What is the constant of variation in this scenario? k) Write an equation for the relationship. 5.6 Connecting Variation, Slope and First Differences What is the connection between variation, slope and first differences? Complete the following statements: Finite differences and the pattern in the x-values can be used to find the the linear relation. The of of variation is also the slope of a linear relation. A constant, or average, rate of change can be interpreted as the of a relation. The slope of a relation can be interpreted as . The formulas to determine the slope of a line are: A line has an equation of the form y = mx + b, where m represents b represents the and A relation has an equation of the form y = mx + b, where m represents b represents the and If a relation has a direct variation then y = mx + b can also be used, where m represents and b = . The Rule of Four can be used to represent a relation in four ways…what are the four ways? 1. 2. Homework questions: 3. p. 284 #1,2,5,7,13,14 4. Test Date:Fri. Oct. 31


