Insulation investigation
advertisement
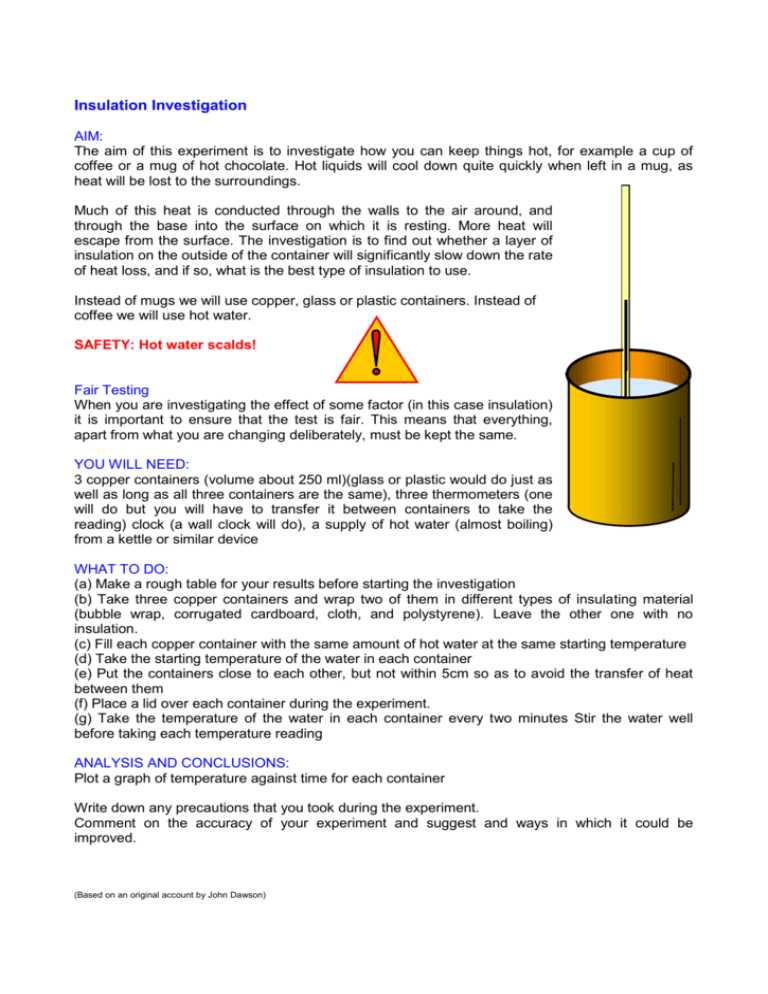
Insulation Investigation AIM: The aim of this experiment is to investigate how you can keep things hot, for example a cup of coffee or a mug of hot chocolate. Hot liquids will cool down quite quickly when left in a mug, as heat will be lost to the surroundings. Much of this heat is conducted through the walls to the air around, and through the base into the surface on which it is resting. More heat will escape from the surface. The investigation is to find out whether a layer of insulation on the outside of the container will significantly slow down the rate of heat loss, and if so, what is the best type of insulation to use. Instead of mugs we will use copper, glass or plastic containers. Instead of coffee we will use hot water. SAFETY: Hot water scalds! Fair Testing When you are investigating the effect of some factor (in this case insulation) it is important to ensure that the test is fair. This means that everything, apart from what you are changing deliberately, must be kept the same. YOU WILL NEED: 3 copper containers (volume about 250 ml)(glass or plastic would do just as well as long as all three containers are the same), three thermometers (one will do but you will have to transfer it between containers to take the reading) clock (a wall clock will do), a supply of hot water (almost boiling) from a kettle or similar device WHAT TO DO: (a) Make a rough table for your results before starting the investigation (b) Take three copper containers and wrap two of them in different types of insulating material (bubble wrap, corrugated cardboard, cloth, and polystyrene). Leave the other one with no insulation. (c) Fill each copper container with the same amount of hot water at the same starting temperature (d) Take the starting temperature of the water in each container (e) Put the containers close to each other, but not within 5cm so as to avoid the transfer of heat between them (f) Place a lid over each container during the experiment. (g) Take the temperature of the water in each container every two minutes Stir the water well before taking each temperature reading ANALYSIS AND CONCLUSIONS: Plot a graph of temperature against time for each container Write down any precautions that you took during the experiment. Comment on the accuracy of your experiment and suggest and ways in which it could be improved. (Based on an original account by John Dawson)
