Micro Ch 29 and 30 Practice Problems Key
advertisement
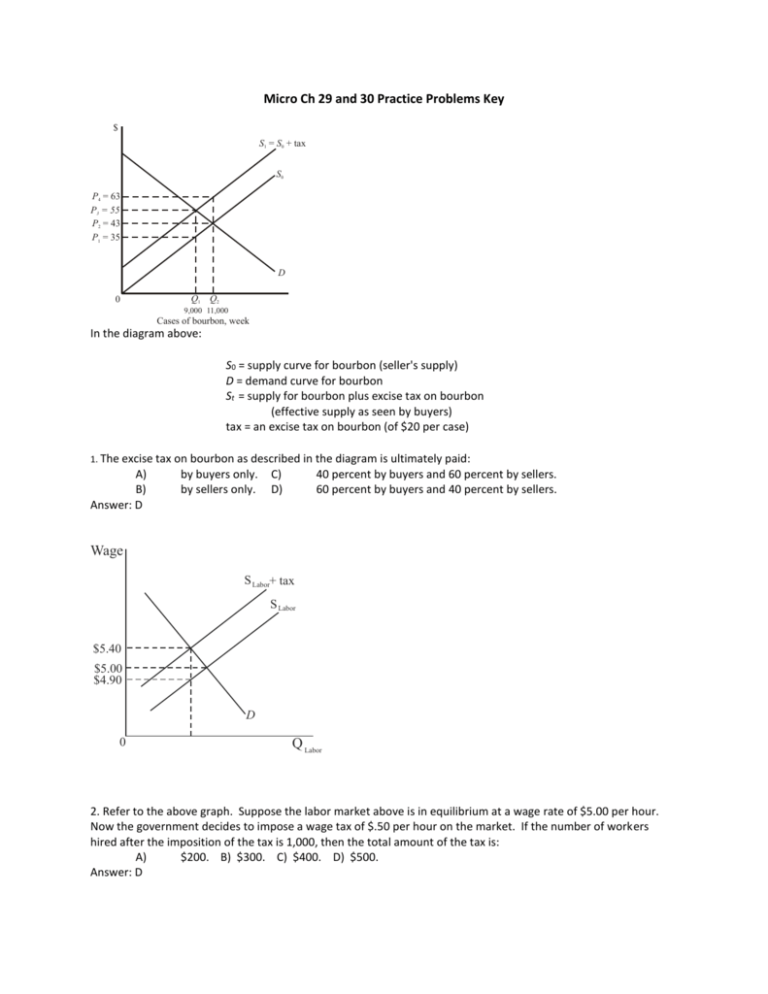
Micro Ch 29 and 30 Practice Problems Key $ S1 = S0 + tax S0 P4 = 63 P3 = 55 P2 = 43 P1 = 35 D 0 Q1 Q2 9,000 11,000 Cases of bourbon, week In the diagram above: S0 = supply curve for bourbon (seller's supply) D = demand curve for bourbon St = supply for bourbon plus excise tax on bourbon (effective supply as seen by buyers) tax = an excise tax on bourbon (of $20 per case) 1. The excise tax on bourbon as described in the diagram is ultimately paid: A) B) Answer: D by buyers only. by sellers only. C) D) 40 percent by buyers and 60 percent by sellers. 60 percent by buyers and 40 percent by sellers. Wage S Labor+ tax S Labor $5.40 $5.00 $4.90 D 0 Q Labor 2. Refer to the above graph. Suppose the labor market above is in equilibrium at a wage rate of $5.00 per hour. Now the government decides to impose a wage tax of $.50 per hour on the market. If the number of workers hired after the imposition of the tax is 1,000, then the total amount of the tax is: A) $200. B) $300. C) $400. D) $500. Answer: D 3. Refer to the above graph. It shows the supply curve for a product before tax (S0 ) and after a $1 excise tax is imposed (S1 ). The excise tax on the product is ultimately paid: A) by buyers only. C) 75 percent by buyers and 25 percent by sellers. B) by sellers only. D) 25 percent by buyers and 75 percent by sellers. Answer: C 4. Refer to the above graph. It shows the supply curve for a product before tax (S0 ) and after a $1 excise tax is imposed (S1 ). If 500 units of the product are sold after the tax is imposed, the amount of tax revenue going to the government is: A) $125. B) $250. C) $375. D) $500. Answer: D 5. Refer to the above graph. It shows the supply curve for a product before tax (S0 ) and after a $1 excise tax is imposed (S1 ). If 500 units of the product are sold after the tax is imposed, the amount of the tax borne by the consumer is: A) $125. B) $250. C) $375. D) $500. Answer: C 6. Refer to the above graph. A tax is imposed that shifts the supply curve from S to S + tax. What is the difference in revenue kept by producers before the tax was imposed and after the tax was imposed? A) $0.75 B) $2.25 C) $4.75 D) $11.25 Answer: C 7. Refer to the above graph. A tax is imposed that shifts the supply curve from S to S + tax. What is the amount of the tax borne by producers? A) $0.75 B) $1.50 C) $11.25 D) $16.00 Answer: A 8. Refer to the above graph. A tax is imposed that shifts the supply curve from S to S + tax. What is the amount of the tax borne by consumers? A) Answer: B $0.75 B) $1.50 C) $11.25 D) $13.50 9. The graph above represents the market for a product where D1 and S1 show the supply and demand curves before the imposition of a sales tax. Following the tax, the government's tax revenue is: A) FIJG. B) ACEG. C) BCEF. D) ABFG. Answer: B 10. The basic purpose of antitrust laws is to: A) achieve subsidies for American business. C) control prices to protect consumers. B) limit monopoly power in industry. D) enforce laws that restrict competition. Answer: B 11. Conglomerate mergers are combinations of: A) many small firms. B) firms producing the same product. C) firms producing unrelated products. D) firms operating at different stages in a given production process. Answer: C 12. A merger between one firm and another firm that is its supplier is known as a: A) horizontal merger. B) vertical merger. C) conglomerate merger. D) parallel merger. Answer: B 13. A merger between McDonald's and Burger King would be an example of a: A) conglomerate merger. B) horizontal merger. C) vertical merger. D) parallel merger. Answer: B 14. An example of a horizontal merger is one between an airline and: A) a chain of hotels. B) another airline. C) an aluminum company. D) a car rental company. Answer: B 15. The merger of a manufacturing firm in one industry with another manufacturing firm in the same industry is called a: A) horizontal merger. B) vertical merger. C) secondary merger. D) conglomerate merger. Answer: A
