Supplementary Information (doc 77K)
advertisement
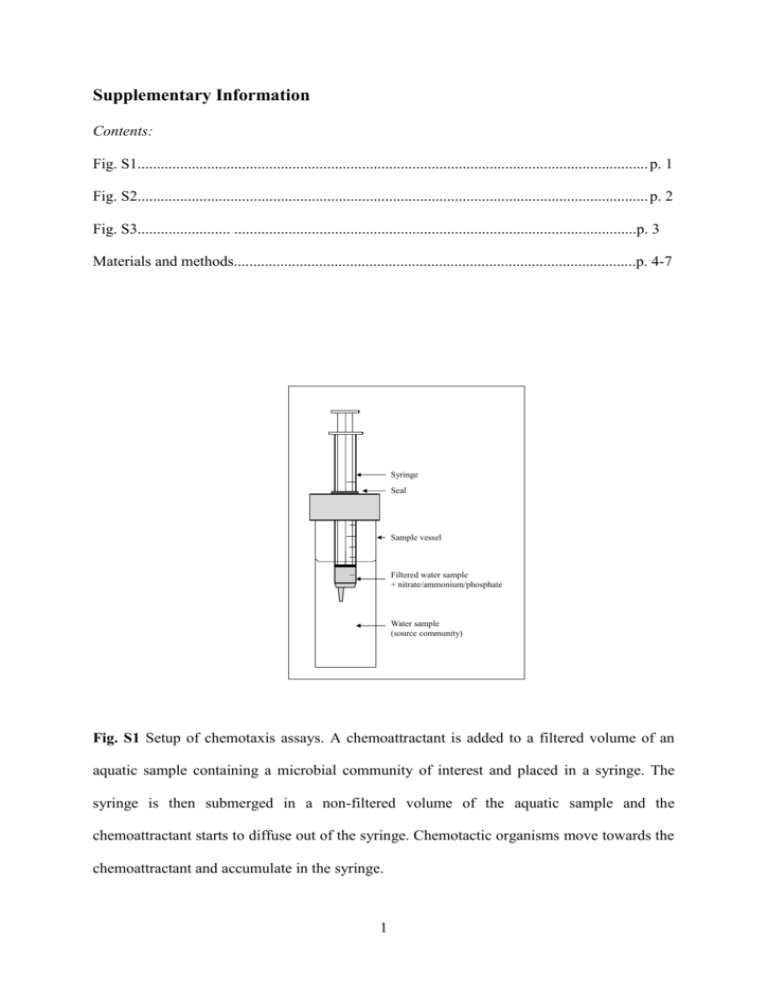
Supplementary Information Contents: Fig. S1.................................................................................................................................... p. 1 Fig. S2.................................................................................................................................... p. 2 Fig. S3........................ ........................................................................................................p. 3 Materials and methods........................................................................................................p. 4-7 Syringe Seal Sample vessel Filtered water sample + nitrate/ammonium/phosphate Water sample (source community) Fig. S1 Setup of chemotaxis assays. A chemoattractant is added to a filtered volume of an aquatic sample containing a microbial community of interest and placed in a syringe. The syringe is then submerged in a non-filtered volume of the aquatic sample and the chemoattractant starts to diffuse out of the syringe. Chemotactic organisms move towards the chemoattractant and accumulate in the syringe. 1 8.E+06 8 *** Cell density (counts ml-1 x 10⁶) 7.E+06 7 *** 6.E+06 6 *** 5.E+06 5 4.E+06 4 3.E+06 3 2.E+06 2 1.E+06 1 0.E+00 0 Lakelake water water Control Control Phosphate Phosphate Nitrate Ammonia Fig. S2 Mean cell counts associated with control and chemoattractant-spiked assays. Error bars represent standard deviations. The asterisks indicate that all chemoattractant-spiked assays contained significantly more cells than the control assays (P < 0.001, GLM). Counts in the assays with attractants did not differ from one another (P > 0.05, GLM). 2 80000000 8 *** 70000000 7 Cell density (counts ml-1 x 10⁶) *** 60000000 6 *** 50000000 5 40000000 4 30000000 3 2 20000000 1 10000000 0 FW T0 FW T30 PO43- NO3- NH4+ Ctrl PO4 NO3 NH4 T30 T30 T30 0 min 30 min (growth stimulation) Ctrl FW PO43- NO3- NH4+ Ctrl PO NO3 NH4 4 Chem Chem Chem Chem 30 min (chemotaxis) Fig. S3 Mean cell counts associated with a) lake water immediately after filtration (0.2 µm), b) filtered lake water with and without inorganic nutrients after 30 min incubation without the syringe tip submerged in lake water (growth stimulation test), and c) filtered lake water with and without inorganic nutrients after 30 min incubation with the syringe tip submerged in lake water (chemotaxis assays). Error bars represent standard deviations. The asterisks indicate that all inorganic nutrient-spiked chemotaxis assays contained significantly more cells than the non-incubated control assay (Ctrl 0 min; P < 0.001, GLM). Counts in the assays with attractants did not differ from one another (P > 0.05, GLM). Negligible growth occurred as a result of adding the nutrients to the filtered lake water indicating that cell counts in the chemotaxis assays reflect cells that moved into the syringes. 3 Materials and methods Sample collection and chemotaxis assays A 1 L water sample was collected from the top 20 cm of a eutrophic lake at The University of Queensland. The lake holds approximately 33 ML water (pH 6) containing 1.5 ppm PO4-P, 0.76 ppm NH4-N and 0.24 ppm NO3-N. Chemotaxis assays were performed by submerging the tips of 1 ml syringes containing 80 µl 0.1 M chemoattractant (nitrate: KNO3, ammonium: NH4Cl, or phosphate: KH2PO4) into 20 ml lake water for 30 min (Fig. S1). Each chemoattractant was prepared in 0.2 µm filtered lake water to ensure that the chemical characteristics of the background solution in the syringe was similar to that in the lake. Filtered lake water control assays with no added chemoattractant were performed in parallel and facilitated the measurement stochastic movement of cells into our assays. All assays were replicated six times, providing three samples for cell counting and three samples for 16S rRNA gene amplicon sequencing. To ensure that cell counts in the assays after 30 mins reflected chemotaxis rather than inorganic nutrient-stimulated growth of residual cells postfiltration we enumerated cells in 0.2 µm filtered lake water with and without added nutrients before and after 30 min incubation without submerging the tip of the syringe in the lake water (Fig. S3). Flow cytometry – Enumeration of microbial cells The contents of each syringe was: 1) stained with 10,000X SYBR Green I for 15 min, 2) diluted 1:10 (non-filtered lake water), or 1:2 (all other samples) with 0.22 µm filtered TE buffer (10 mM Tris, 1 mM EDTA, pH 8.0), and then 3) supplemented with yellow-green carboxylate-modified microspheres (used as reference objects; Invitrogen) to a final 4 concentration of 105 beads ml-1. Cell counts were measured using a Becton Dickinson LSRII flow cytometer (BD, Australia) equipped with an FITC 200 filter and a 5 W argon-ion laser operated at 20 mW, 488 nm. DNA extraction, PCR and pyrosequencing Three replicate samples were pooled (240 µl final volume), and then centrifuged at 14,000 g, 15 min. After removing the supernatant, pelleted cells were resuspended in 10 µl Lyse and Go PCR reagent (Thermo Scientific) and genomic DNA was extracted according the manufacturer’s instructions. PCRs were then performed in 50 µl volumes each containing 5 µl DNA extract, molecular biology grade water, 1X PCR Buffer minus Mg2+ (Invitrogen), 50 nM of each of the dNTPs (Invitrogen), 1.5 mM MgCl2 (Invitrogen), 0.3 mg BSA (New England Biolabs), 0.02 U Taq DNA Polymerase (Invitrogen), and 8 µM each of the primers 926F and 1392R (Engelbrektson et al., 2010) modified on the 5’ end to contain the 454 FLX Titanium Lib L adapters B and A, respectively. The reverse primers also contained a 5-6 base barcode sequence positioned between the primer sequence and the adapter. A unique barcode was used for each sample. Thermocycling conditions were as follows: 95°C for 1 min; then 34 cycles of 95°C for 1 min, 55°C for 45 s, 72°C for 90 s; then 72°C for 10 min. Amplifications were performed using a Veriti® 96-well thermocycler (Applied Biosystems). Amplicons were purified using a QIAquick PCR purification kit (Qiagen), quantified using a NanoDrop ND-1000 spectrophotometer (Thermo Fisher Scientific, USA) and then normalised to 25 ng µl-1 and pooled for 454 pyrosequencing. Sequencing was performed by Macrogen Inc. (Seoul, Korea). Data analyses 5 Data were analysed as described in Dennis et al., (2012), briefly, sequences were quality filtered and dereplicated using the QIIME script split_libraries.py with the homopolymer filter deactivated (Caporaso, et al., 2010) and then checked for chimeras against the GreenGenes databases using UCHIME ver. 3.0.617 (Edgar, et al., 2011). Homopolymer errors were corrected using Acacia (Bragg et al., 2012). Sequences were then subjected to the following procedures using QIIME scripts with the default settings: 1) sequences were clustered at 97% similarity, 2) cluster representatives were selected, 3) GreenGenes taxonomy was assigned to the cluster representatives using BLAST, and 4) tables with the abundance of different operational taxonomic units (OTUs) and their taxonomic assignments in each sample were generated. The number of reads was then normalised to 6500 per sample. Variation in the composition of microbial communities between normalised samples (beta diversity) was investigated using Principal Component Analysis (PCA). Differences in cell counts between assays were compared using Generalised Linear Modelling (GLM). All analyses were implemented using R 2.12.0 (R Development Core Team, 2010). The phylogeny of certain key OTUs was inferred using Arb (Ludwig et al., 2004), which facilitated comparisons between our query sequences and full length sequences in the GreenGenes database. References Bragg L, Stone G, Imelfort M, Hugenholtz P, Tyson GW. (2012). Fast, accurate errorcorrection of amplicon pyrosequences using Acacia. Nat Meth 9:425-426. 6 Caporaso JG, Kuczynski J, Stombaugh J, Bittinger K, Bushman FD, Costello EK, et al. (2010). QIIME allows analysis of high-throughput community sequencing data. Nat Meth 7:335-336. Dennis PG, Guo K, Imelfort M, Jensen P, Tyson GW, Rabaey KR. (2013). Spatial uniformity of microbial diversity in a continuous bioelectrochemical system. Bioresource Technol 129:599–605. Edgar RC, Haas BJ, Clemente JC, Quince C, Knight R. (2011). UCHIME improves sensitivity and speed of chimera detection. Bioinformatics doi: 10.1093/bioinformatics/btr381. Engelbrektson A, Kunin V, Wrighton KC, Zvenigorodsky N, Chen F, Ochman H, et al. (2010). Experimental factors affecting PCR-based estimates of microbial species richness and evenness. ISME J. 4:642-647. Ludwig W, Strunk O, Westram R, Richter L, Meier H, Kumar Y, et al. (2004). ARB: a software environment for sequence data. Nucleic Acids Res 32:1363-1371. R Development Core Team. (2005). R, a language and environment for statistical computing. R Foundation for Statistical Computing, Vienna, Austria, http://www.R-project.org. 7
