Transformations of Functions: Part 1
advertisement
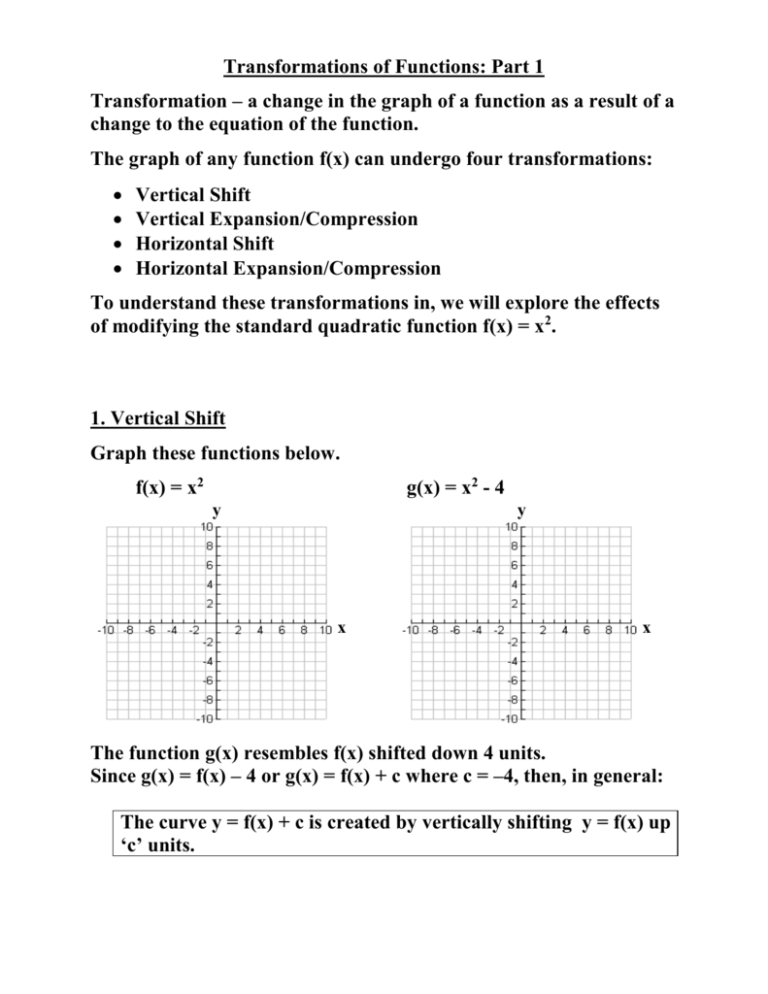
Transformations of Functions: Part 1 Transformation – a change in the graph of a function as a result of a change to the equation of the function. The graph of any function f(x) can undergo four transformations: Vertical Shift Vertical Expansion/Compression Horizontal Shift Horizontal Expansion/Compression To understand these transformations in, we will explore the effects of modifying the standard quadratic function f(x) = x2. 1. Vertical Shift Graph these functions below. f(x) = x2 g(x) = x2 - 4 y y x x The function g(x) resembles f(x) shifted down 4 units. Since g(x) = f(x) – 4 or g(x) = f(x) + c where c = –4, then, in general: The curve y = f(x) + c is created by vertically shifting y = f(x) up ‘c’ units. 2. Vertical Expansion Graph these functions below. f(x) = x2 g(x) = 2x2 y y x x The function g(x) resembles f(x) but expanded vertically by a factor of 2. Since g(x) = 2f(x) or g(x) = af(x) where a = 2, then, in general: The curve y = af(x) is created by vertically expanding y = f(x) by a factor of ‘a’. 3. Horizontal Shift Graph these functions below. f(x) = x2 g(x) = (x - 3)2 y y x x The function g(x) resembles f(x) shifted right 3 units. Since g(x) = f(x-3) or g(x) = f(x - d) where p = 3, then, in general: The curve y = f(x - d) is created by horizontally shifting y = f(x) right ‘d’ units. 4. Horizontal Expansion Graph these functions below. f(x) = x2 g(x) = (2x)2 y y x x The function g(x) resembles f(x) but expanded horizontally by a factor of ½ . Since g(x) = f(2x) or g(x) = f(kx) where k = 2, then, in general: The curve y = f(kx) is created by horizontally expanding y = f(x) by a factor of ‘ 1 ’. k If k>1 or k<-1 then the curve is compressed horizontally. If -1<k<1 then the curve is expanded horizontally. Summary If we start with the graph of y = f(x) then: y = f(x) + c is vertically shifted up by ‘c’ units. y = af(x) is vertical expanded by a factor of ‘a’. y = f(x - d) is horizontally shifted right by ‘d’ units. y = f(kx) is horizontally expanded by a factor of ‘ 1 ’. k Activity Graph the functions on the left by using the table of values. Graph the functions on the right using a transformation. a) y | x | x -3 -2 -1 0 1 2 3 b) y | x | 3 y y x y x y 1 x x y -10 -2 -0.5 0 0.5 2 10 x y y 2x x y 0 1 4 9 c) y y x x y y x 1 x2 y x
