The Superconducting Magnet for the BABAR Detector of the
advertisement

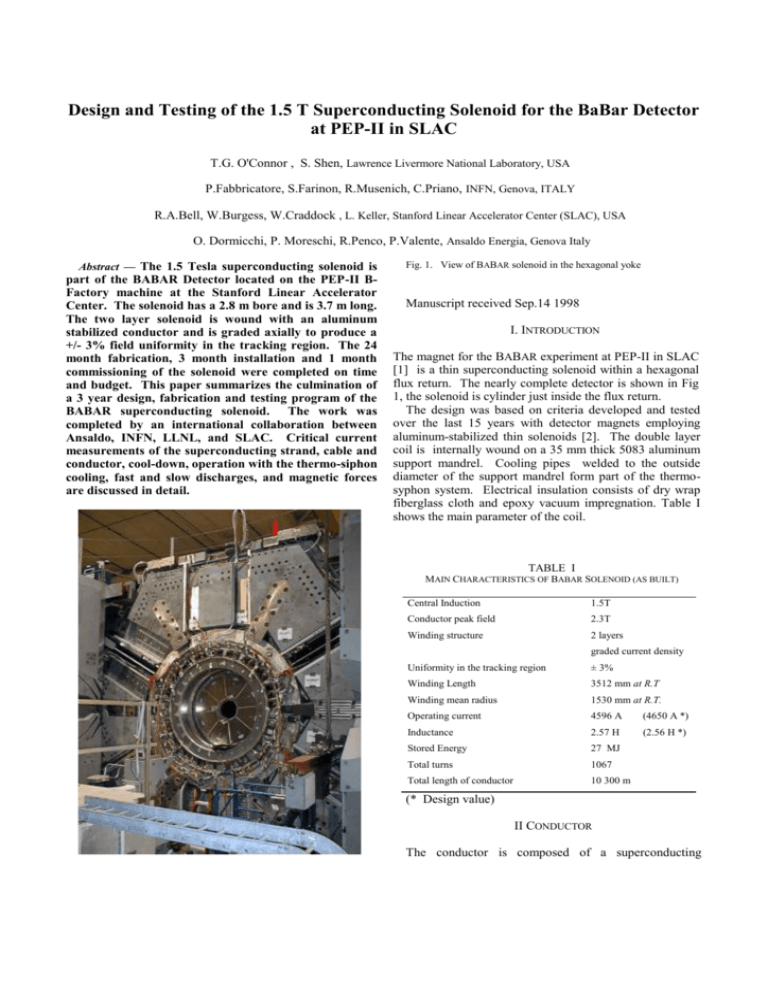
Design and Testing of the 1.5 T Superconducting Solenoid for the BaBar Detector at PEP-II in SLAC T.G. O'Connor , S. Shen, Lawrence Livermore National Laboratory, USA P.Fabbricatore, S.Farinon, R.Musenich, C.Priano, INFN, Genova, ITALY R.A.Bell, W.Burgess, W.Craddock , L. Keller, Stanford Linear Accelerator Center (SLAC), USA O. Dormicchi, P. Moreschi, R.Penco, P.Valente, Ansaldo Energia, Genova Italy Abstract — The 1.5 Tesla superconducting solenoid is part of the BABAR Detector located on the PEP-II BFactory machine at the Stanford Linear Accelerator Center. The solenoid has a 2.8 m bore and is 3.7 m long. The two layer solenoid is wound with an aluminum stabilized conductor and is graded axially to produce a +/- 3% field uniformity in the tracking region. The 24 month fabrication, 3 month installation and 1 month commissioning of the solenoid were completed on time and budget. This paper summarizes the culmination of a 3 year design, fabrication and testing program of the BABAR superconducting solenoid. The work was completed by an international collaboration between Ansaldo, INFN, LLNL, and SLAC. Critical current measurements of the superconducting strand, cable and conductor, cool-down, operation with the thermo-siphon cooling, fast and slow discharges, and magnetic forces are discussed in detail. Fig. 1. View of BABAR solenoid in the hexagonal yoke Manuscript received Sep.14 1998 I. INTRODUCTION The magnet for the BABAR experiment at PEP-II in SLAC [1] is a thin superconducting solenoid within a hexagonal flux return. The nearly complete detector is shown in Fig 1, the solenoid is cylinder just inside the flux return. The design was based on criteria developed and tested over the last 15 years with detector magnets employing aluminum-stabilized thin solenoids [2]. The double layer coil is internally wound on a 35 mm thick 5083 aluminum support mandrel. Cooling pipes welded to the outside diameter of the support mandrel form part of the thermosyphon system. Electrical insulation consists of dry wrap fiberglass cloth and epoxy vacuum impregnation. Table I shows the main parameter of the coil. TABLE I MAIN CHARACTERISTICS OF BABAR SOLENOID (AS BUILT) Central Induction 1.5T Conductor peak field 2.3T Winding structure 2 layers graded current density Uniformity in the tracking region ± 3% Winding Length 3512 mm at R.T Winding mean radius 1530 mm at R.T. Operating current 4596 A (4650 A *) Inductance 2.57 H (2.56 H *) Stored Energy 27 MJ Total turns 1067 Total length of conductor 10 300 m (* Design value) II CONDUCTOR The conductor is composed of a superconducting Rutherford type cable embedded in a pure aluminum matrix through a co-extrusion process, which ensures good bonding between the aluminum and the superconductor. In order to have a field homogeneity of +/- 3% in the large volume specified by the BaBar experiment, the current density in the winding is graded: lower in the central region and higher at the ends. The gradation is obtained by using conductor of two different thickness: 8.4 mm for the central region and 5 mm for the ends. Both 20 mm wide conductors are composed of a 16 strand Rutherford cable stabilized by pure aluminum. Table II describes the strands, the Rutherford cable and the final conductor characteristics as designed. Table III summarizes some characteristics of the conductors which were supplied by Europa Metalli (Fornaci di Barga –Italy). The co-extrusion processes were carried out at ALCATEL SWISS CABLE under assistance of ETH Zurich. Critical current measurements were carried out on the Rutherford cables which were extracted from the pure aluminum matrix by chemical etching. The samples were arranged with the field normal to the wide face in order to reproduce the same field conditions experienced by the conductor inside the BaBar coil. The short samples were measured in the facility MA.RI.S.A., using the transformer method [3]. For each short sample critical current measurements were performed at different magnetic fields, see Fig. 2 The critical field at 2.5 T was extrapolated from Fig. 2 and is listed in Table III. The critical current for all lengths is greater then the specified value: Ic(B = 2.5 T; T = 4.2 K) = 12680 A. layer, the conductor margins were re-computed taking into account modifications to the peak field, critical current, and nominal current for these three sectors. The calculated values are listed in Table IV. The highest In over Ic ratio for the thick conductor was, In/Ic= 0.33. The lowest current sharing temperature is the forward thin conductor, T g =7.28 K. As a result of changing to a 2-layer design the coil has more temperature margin than the original single layer coil. In fact it is possible to tolerate an increase of temperature of up to 2.78 K higher than the nominal value. TABLE II SUMMARY OF SPECIFICATION FOR STRANDS, RUTHERFORD AND FULL CONDUCTOR Component Characteristic Value Strand NbTi Nb 46.5 +/- 1.5 wt % Ti < 40 m 25 mm > 1.1 Final >100 0.8 mm + 0.005 < 90 mm 16 1.4 x 6.4 mm2 >1000 Rutherford Conductor In sample #3 the superconducting to normal transition was not observed, because the sample quenched before a significant voltage was measured. This was attributed to poor soldering of the sample within its holder. For this sample only, the quench current at different applied magnetic fields was measured. While sample #3 values listed in Table III are lower than the real critical currents, they are higher than those required by the critical current specifications (see Fig. 2). Using the packing factor of the completed coil the nominal current was found to be In= 4650 A. Since the field is higher in the inner layer, making this the more critical (4.93 x 20)+0.02 mm (8.49 x 20)+0.02 mm > 20 MPa 23.5:1.1:1 42.4:1.1:1 > 0.2 mm 12680 A TABLE III RESULTS OF THE CRITICAL CURRENT TESTS. III CONDUCTOR MARGINS The peak field in the BaBar coil preliminary design, a single layer winding, was Bpeak = 2.5 T. At this field the critical temperature for NbTi is T C = 8.27 K. The current sharing temperature for this single layer design is 6.79 K. During the engineering design phase the coil configuration was modified from a single layer to a double layer design to increase the stability margin. This led to a reduction in the peak field of the thin conductor from 2.5 T to 2.3 T. Filament size Twist pitch Cu/NbTi ratio Cu RRR Wire diameter Transposition pitch Number of strands Final size Al-RRR Dimensions: Thin conductor Thick conductor Rutherford-Al bonding Al/Cu/NbTi ratio: Thin conductor Thick conductor Edge curvature radius Critical current @ T=4.2 K; B=2.5 T Sample Ic (B=2.5 T, T=4.2K) N value #1 thin 16800 A 27 #3 thick 15430 A // #4 thin 15250 A 29 #5 thin 17660 A 40 #7 thick 14250 A 20 #9 thin 17810 A 36 TABLE IV ELECTRICAL AND THERMAL MARGINS OF THE BABAR COIL AS CONSTRUCTED Length Bpeak #5 inner layer thin forward #7 inner layer thick middle #9 inner layer thin backward In / Ic Tg (K) (T) Ic (A) T=4.5 K, B= Bpeak 2.3 16550 28% 7.28 1.6 14220 33% 7.30 2.3 16950 27% 7.30 A parameter of interest is the enthalpy variation from 4.5 K to 7.28 K: 7.28 Eu.v. Cp(T )dT (1) 4.5 where Cp(T) is the specific heat (in J/Kg) and the density. The coil is indirectly cooled at an operating temperature of 4.5 K using the thermo-siphon technique. The liquid helium is circulated in channels welded to the support cylinder. The pipings were designed for a steadystate cooling flow of 30 g/sec. Cooldown and cryogenic supply to the coil and 40 K radiation shields is accomplished by a modified Linde TCF-200 liquefier/refrigerator. Liquid helium and cold gas from the liquefier/refrigerator and its 4000 l storage dewar is supplied to the coil and shields via 60 m long, coaxial, return gas screened, flexible transfer line. The schematic of the cooling system is shown in fig. 3. It is possible to cool down the coil by a mixture of warm and cold He gas or by supplying colder and colder gas through the refrigerator. The shields are cooled by part of gas coming back from coil. The cold-down took about a week as shown in fig.4 The heat load at 4.5 K was performed by closing the input valve to the 4000 l control dewar and by measuring the LHe consumption in that dewar. This test gives pessimistic information because the transfer line losses are included too. Fig. 2, Critical current and quench currents vs. applied field [where applied field = external field plus the sample self field (B sf = 0.68 Gauss/A)] performed on the six samples. The thick solid line represents the specification. By averaging the thermal properties among the four components of the winding, aluminum, copper, NbTi and 3 fiberglass epoxy, we find Eu.v.=3635 J/m . This enthalpy margin can be re-written in a more convenient way as energy per unit conductor length, resulting Eu.l. = 0.36 J/m for thin conductor and Eu.l. = 0.65 J/m for thick conductor. As comparison, ALEPH and CDF, two well known operational magnets, have an Eu.l. 0.35 J/m and 0.1 J/m respectively. IV. CRYOGENICS Fig. 3, Schematic of cryogenic circuit Te mp era tur e (K ) 300 .0 250 .0 200 .0 150 .0 100 .0 50. 0 0. 0 0.0 0 shield temperature) is about 250 J/g, the total loads at the shield is 87 W. V. OPERATION The coil current was incrementally increased to a 4605 A. The central field measured with an Hall probe was 1.503 T. The operating current for 1.50 T was then determined to be 4596 A and the design current (1.05 times the nominal current) was determined to be 4825 A. 2.0 0 4.0 6.0 0 Time 0 8.0 0 10. 00 On charging the coil at 1.00 A/s the inductive voltage across the coil was 2.573V. The measured inductance is 2.573 H, which is in good agreement with computation (2.56 H). The final step in the commissioning process was to the solenoid charged to the design current of 4826 A. The measured field at the design current was 1.58 T. During these tests two fast ids-charge occurred due to false trigger of the Quench Detector System. This problem was fixed by modifying the front end electronic of the QDS. Fig. 4, Coil average temperature during cool-down TABLE V DESIGN SOLENOID CRYOGENIC HEAT LOADS Item Liquefaction g/s (l/h) Current Leads Solenoid Radiation and Conduction Heat Load and Valve box Heat Load Solenoid Heat Shield Heat Load Total Steady State Load 0.42 (12) Refrigeration at 4.4K (Watts) Liquid Nitrogen At 77 K (Watts) 70 350 0.42 (12) 70 350 A total amount of 35 (+2, -3) W loss was measured., with no power in the coil. During the test the mass flow rate in each lead was 70 NLP/m, this means a load of 4 W per lead. When coil was powered at 1.58 T the mass flow rate per lead (at a voltage across each led of 40 mV) was 90 NLP/m corresponding to a heat load of 5 W per lead. Mixing these data and considering that 3 W loss can be due to the transfer line we can assume that heat load is between 19 W and 24 W + 14 l/h. This very low value of the loss is partially due to the shield temperature (45 K as shown later. The shields were cooled by cool gas helium coming from the LHe reservoir in the Valve Box. The shield temperatures ranges between 37 and 49K with a mass flow rate of 0.35 g/s. Since the enthalpy variation of gas helium at atmospheric pressure between 4.5 and 45 K(average VI. FAST AND SLOW DISCHARGE The coil is protected with the usual method of resistor in parallel. If a quench is detected (50 mV unbalance signal between the two voltages in two layers), a breaker opens, closing the current in coil and dump resistor. The peak voltage at the coil ends can be as high as 320V. Considering that the center tap of the dump resistor was shorted to ground, the maximum voltage to ground is 170 V. Fig. 5 and 6 below show current and voltage during a fast dump from 4600 A. The two voltage signals are that ones at the two layers. The fast ids-charge from the nominal current causes a quench due the heating of the supporting cylinder (Quench Back). The coil temperature increases to 37 K uniformly. In these conditions about 5 hours are needed to cool-down the coil again, fill the reservoir and be ready for re-starting. Current (Amp) 5000 4500 Current 4000 respect to iron (as resulted from ANSYS computation). When positioning the coil, the aim was to set the displacement to 30 mm in order to have a maximum force at 2500 A and few ton at full current. The offset force is not equally shared by the three tie rods. The average strain in the three tie rods is 500 m corresponding to 0.3 mm displacement. The displacement measured with mechanical probes gave 1 mm axial displacement. This could be due to the spring washers on tie rods, causing a displacement not resulting as stress on tie rods. 3500 3000 2500 -2 0 2 4 6 8 Time (Sec) 1 1.0 10 Total force (metric ton) Fig. 5, Coil current during fast ids-charge. Time t=0 is the breaker opening -0.2 Voltage (Volt) 8.0 10 Total force (metric ton) 0.2 -0.6 tie rod 1 0 tie rod 2 tie rod 3 0 6.0 10 0 4.0 10 0 2.0 10 DV11 DV12 -1 0 0.0 10 0.0 1000.0 2000.0 3000.0 Current (A) 4000.0 5000.0 -1.4 Fig. 7, Axial forces in the solenoid backward end tie rods. -1.8 -1 0 1 2 3 4 5 Time (Sec) Fig. 6, Voltages (arbitrary units) at two coil layers during fast idscharge the VII. MAGNETIC FORCES The coil is placed inside a non-symmetric flux return yoke. This gives rise to axial offset forces. In order to have an offset force in one direction only (no inversion during the ramp up), the coil was positioned with 30 mm axial displacement in the forward direction. Fig. 7 shows the axial offset force as resulted from the strains in the three Inconel 718 tie rods placed at the backward side. Forces on single tie rod and total force (sum of the three) are shown. The total force is forward directed and has a maximum of 8 ton at 3800 A. The three tie rods at the opposite side (forward) are no strained. The force behavior vs. current is in agreement with a axial displacement of 33 mm in forward direction of coil with Fig. 8 shows the net axial force on the coil versus the fraction of nominal current. The solid line is a calculation using the MERMAID 2D code [4] and the diamonds are measurements using strain gauges attached to the axial tie rods. The net axial force is the difference of two large compressive forces of approximately 380 MT on the forward and backward ends of the coil. It is very sensitive to the axial location of the coil within the barrel; the gradient is approximately 1.5 MT/mm of axial displacement. Even though the shapes of the measured and calculated curves are somewhat different, the agreement is remarkably good considering the uncertainty in the location of the coil and the magnet model. Net Axial Force (Metric Tons) 15 2D Mermaid Model Measured 10 5 Positive force is forward Coil offset = 32 mm forward Bucking coil current = 0 0 0 0.2 0.4 0.6 0.8 1 Fraction of Nominal Current Fig. 8, Net axial force on the superconducting solenoid vs. fractional current. VIII. SUMMARY The superconducting solenoid was successfully commissioned in March 1998, the solenoid was then warmed up for final assembly of the BABAR detector. The solenoid will be operational again in November 1998 IX. ACKNOWLEDGMENTS We wish to thank all concerned who contributed to the design, tests, analysis and graphics contained in this paper. REFERENCES [1] BABAR collaboration 'Technical design report," SLAC note R-95457, 1995 [2] H.Desportes et al, 'Construction and Test of the CELLO Thin-Wall Solenoid' Ad. Cryogenic Eng. 25, p. 175, 1980 [3] P.Fabbricatore, R.Musenich, and R.Parodi, "Inductive method for critical measurement of superconducting cables for high energy physics applications," NIM, vol. A302, 1991, pp. 27-35 [4] Program MERMAID was written at the Budker Institute of Physics, Novosibirsk, 1994.


