Finding the Epicenter Activity Moderate 10 11
advertisement
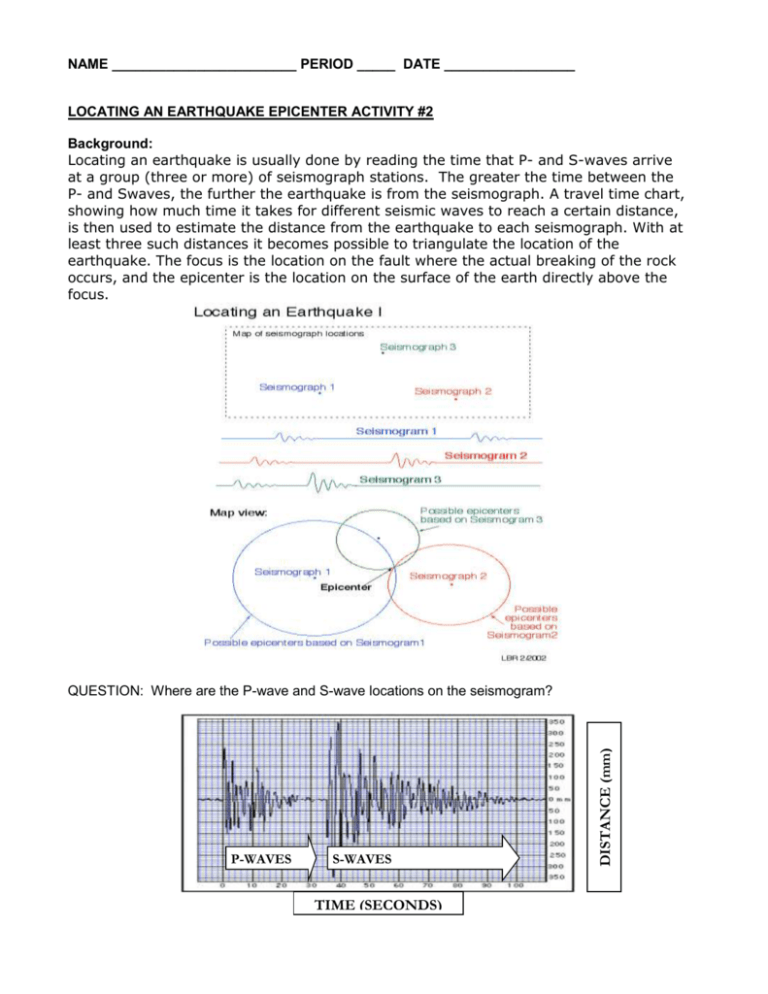
NAME ________________________ PERIOD _____ DATE _________________ LOCATING AN EARTHQUAKE EPICENTER ACTIVITY #2 Background: Locating an earthquake is usually done by reading the time that P- and S-waves arrive at a group (three or more) of seismograph stations. The greater the time between the P- and Swaves, the further the earthquake is from the seismograph. A travel time chart, showing how much time it takes for different seismic waves to reach a certain distance, is then used to estimate the distance from the earthquake to each seismograph. With at least three such distances it becomes possible to triangulate the location of the earthquake. The focus is the location on the fault where the actual breaking of the rock occurs, and the epicenter is the location on the surface of the earth directly above the focus. P-WAVES S-WAVES TIME (SECONDS) DISTANCE (mm) QUESTION: Where are the P-wave and S-wave locations on the seismogram? Classroom Activity: 1. Study the three sections of seismograms shown below. 2. Each seismogram indicates the arrival time of the P waves and S waves of the same earthquake, as recorded at three different stations around Charleston, SC (Branch, Timber, James). Locate the arrival time of the P waves for each seismogram to the nearest second and record in data chart 1. 3. Locate the arrival time of the S waves for each seismogram and record in data chart 1. 4. Determine the difference, in seconds, between the arrival time of the P and S waves on each seismogram and record in data chart 1. Data Chart 1 STATION BRANCH JAMES TIMBR ARRIVAL TIME P-WAVE ARRIVAL TIME S-WAVE DIFFERENCE IN TIME OF ARRIVAL 5. Look at the graph on the following page and answer the questions below: 1) What amount of time does each increment on the vertical (y) axis represent? 2) How many kilometers does each increment on the horizontal (x) axis represent? 3) How long does it take a P wave to travel 150 km from an epicenter? 4) How long does it take an S wave to travel 150 km from the same epicenter? 5) How much longer does it take an S wave to travel 150 km than a P Wave? 6) How much longer does it take an S wave to travel 200 km than a P wave? 7) In general, what happens to the difference in travel times as the distance increases? 6. Lay the edge of a small piece of paper along the vertical axis so that one end is even with the “0” coordinate. Mark off the “0” point as well as a distance on the edge of the paper that represents 30 seconds. 7. Slide the marked paper along the P and S curves of the graph until the upper mark (30s mark) lies on the S curve, and the lower mark (0s mark) on the P curve. Be sure the edge of the paper lines up with the vertical lines of the graph. 8. According to the graph, how far from the epicenter does 30seconds represent? 9. To find the distance to the epicenter of the earthquake, repeat steps 6-8 for the three stations by using the “Difference in Time of Arrival” for each. Record in data chart 2. Data Chart 2 STATION BRANCH JAMES TIMBR DISTANCE OF STATION FROM EPICENTER 10.Which station is the farthest from the epicenter? 11.Look at the map for the stations. Determine the scale (hint: how many kilometers is one degree of latitude). ______________ 12.Using the scale, set your compass radius to the distance of the epicenter from the Branch station. With this radius and Branch station as the center, draw a circle on the map. The epicenter of the earthquake lies somewhere on this circle. Why can’t its exact position be determined from this circle? 13.Repeat step 12, setting your compass for the radius for the distance of the epicenter from the James station. At how many points do the two circles intersect? ___________ 14.The epicenter must lie on one of these two points. Why? 15.Repeat step 12 for the Timbr station. At how many points do the three circles intersect? ______________ What does the point where they intersect represent? Explain. 16.Near what latitude and longitude shown on the map might the earthquake have occurred?

