AP Statistics - Introduction to Probability
advertisement

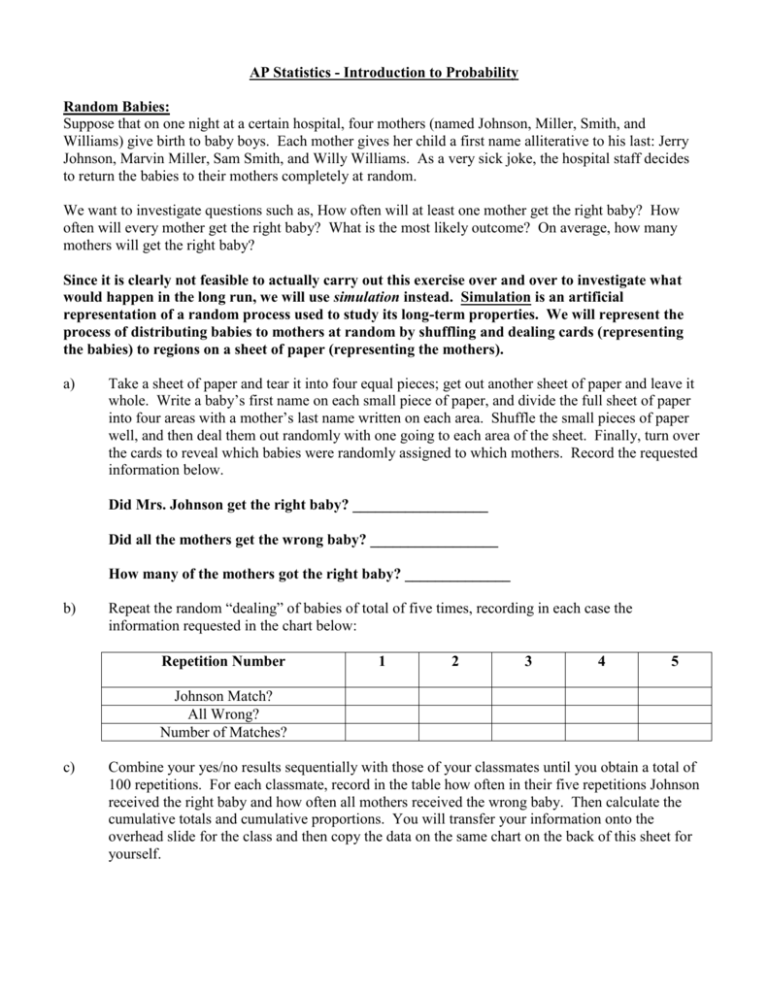
AP Statistics - Introduction to Probability Random Babies: Suppose that on one night at a certain hospital, four mothers (named Johnson, Miller, Smith, and Williams) give birth to baby boys. Each mother gives her child a first name alliterative to his last: Jerry Johnson, Marvin Miller, Sam Smith, and Willy Williams. As a very sick joke, the hospital staff decides to return the babies to their mothers completely at random. We want to investigate questions such as, How often will at least one mother get the right baby? How often will every mother get the right baby? What is the most likely outcome? On average, how many mothers will get the right baby? Since it is clearly not feasible to actually carry out this exercise over and over to investigate what would happen in the long run, we will use simulation instead. Simulation is an artificial representation of a random process used to study its long-term properties. We will represent the process of distributing babies to mothers at random by shuffling and dealing cards (representing the babies) to regions on a sheet of paper (representing the mothers). a) Take a sheet of paper and tear it into four equal pieces; get out another sheet of paper and leave it whole. Write a baby’s first name on each small piece of paper, and divide the full sheet of paper into four areas with a mother’s last name written on each area. Shuffle the small pieces of paper well, and then deal them out randomly with one going to each area of the sheet. Finally, turn over the cards to reveal which babies were randomly assigned to which mothers. Record the requested information below. Did Mrs. Johnson get the right baby? __________________ Did all the mothers get the wrong baby? _________________ How many of the mothers got the right baby? ______________ b) Repeat the random “dealing” of babies of total of five times, recording in each case the information requested in the chart below: Repetition Number 1 2 3 4 5 Johnson Match? All Wrong? Number of Matches? c) Combine your yes/no results sequentially with those of your classmates until you obtain a total of 100 repetitions. For each classmate, record in the table how often in their five repetitions Johnson received the right baby and how often all mothers received the wrong baby. Then calculate the cumulative totals and cumulative proportions. You will transfer your information onto the overhead slide for the class and then copy the data on the same chart on the back of this sheet for yourself. Pair 1 2 3 4 5 6 7 8 9 10 11 12 13 14 15 16 17 18 19 20 d) Cumulative Johnson Matches? Repetitions Of these 5 Cum. Total Cum. Proportion 5 10 15 20 25 30 35 40 45 50 55 60 65 70 75 80 85 90 95 100 All Wrong? Of these 5 Cum. Total Cum. Proportion Plot the cumulative relative frequencies as a function of repetitions for both of these variables below: 1.0 0.5 0.0 5 e) 10 15 20 25 30 35 40 45 50 55 60 65 70 75 80 85 90 95 100 Do the relative frequencies appear to be “settling down” and approaching one particular value? What might you guess that one value is? The probability of a random event is the long-run proportion (or relative frequency) of times the event would occur if the random process were repeated over and over under identical conditions. One can approximate a probability by simulating the process a large number of times. Simulations leads to an empirical estimate of the probability. f) Now combine your results on a number of matches with the rest of the class, obtaining a tally of how often each outcome occurred. Record the counts and proportions in the table below. Number of Matches Count Proportion 0 1 2 3 4 Total 1.00 g) In what proportion of these simulated cases did at least one mother get the correct baby? h) Based on the simulation results of the class, what is your empirical estimate of the probability of no matches? i) Based on the simulation results of the class, what is your empirical estimate of the probability of at least one match? j) Explain why an outcome of exactly three matches is impossible. k) Is it impossible to get four matches? Would you call it rare? Unlikely? Explain. l) Would you consider a result of 1 matches, or of 1 match, or of 2 matches, to be unlikely? Explain. Pair 1 Cumulative Johnson Matches? Repetitions Of these 5 Cum. Total Cum. Proportion 5 2 10 3 15 4 20 5 25 6 30 7 35 8 40 9 45 10 50 11 55 12 60 13 65 14 70 15 75 16 80 17 85 18 90 19 95 20 100 All Wrong? Of these 5 Cum. Total Cum. Proportion Part II: In situations where the outcomes of a random process are equally likely, exact probabilities can be calculated by listing all of the possible outcomes and counting the proportion that corresponds to the event of interest. The listing of all possible outcomes is called the sample space. The sample space for the “random babies” activity consists of all possible ways to distribute the four babies to the four mothers. Let 1234 mean that the first baby went to the first mother, the second baby went to the second mother, the third baby went to the third mother, and the fourth baby went to the fourth mother. In this scenario all four mothers get the correct baby. As another example, 1243 would mean that the first two mothers got the right baby, but the third and fourth mothers had their babies switched. All of the possibilities are listed below: 1234 2134 3124 4123 a) 1243 2143 3142 4132 1324 2314 3214 4213 1342 2341 3241 4231 1423 2413 3412 4312 1432 2431 3421 4321 How many different arrangements are there for returning the four babies to their mothers? b) For each of these arrangements, indicate how many mothers get the correct baby: 1234: 4 matches 1243: 2 matches 1324 1342 1423 2134 2143 2314 2341 2413 3124 3142 3214 3241 3412 4123 4132 4213 4231 4312 c) In how many arrangements is the number of “matches” equal to exactly: 4:_____________ d) 1432 2431 3421 4321 3:_____________ 2:_____________ 1:_____________ 0:___________ Calculate the (exact) probabilities by dividing your answers to (c) by your answer to (a). 4:_____________ 3:_____________ 2:_____________ 1:_____________ 0:___________ Comment below on how closely the exact probabilities correspond to the empirical (theoretical) probabilities from the simulation recorded in part (f) from Part I of this activity. An Empirical Estimate from a simulation generally gets closer to the actual probability as the number of repetitions increases. Look at the histograms below: e) Generally speaking, which of these three simulations produces empirical estimates closest to the actual probabilities? Explain your answer fully. f) For your class simulation results summarized in (f) from Part I, calculate the average (mean) number of matches per repetition of the process by multiplying each outcome by the number of occurrences, summing the products, and then dividing by the total number of repetitions. The long-run average value achieved by a numerical random process is called its expected value. To calculate this expected value from the (exact) probability distribution, multiply each outcome by its probability, and then add these up over all the possible outcomes. g) Calculate the expected number of matches from the (exact) probability distribution, and compare that to the average number of matches from the simulated data.


