Maps: A Visualization Tool
Name:
Activity 2: Contour Maps
Lab Section:
Date:
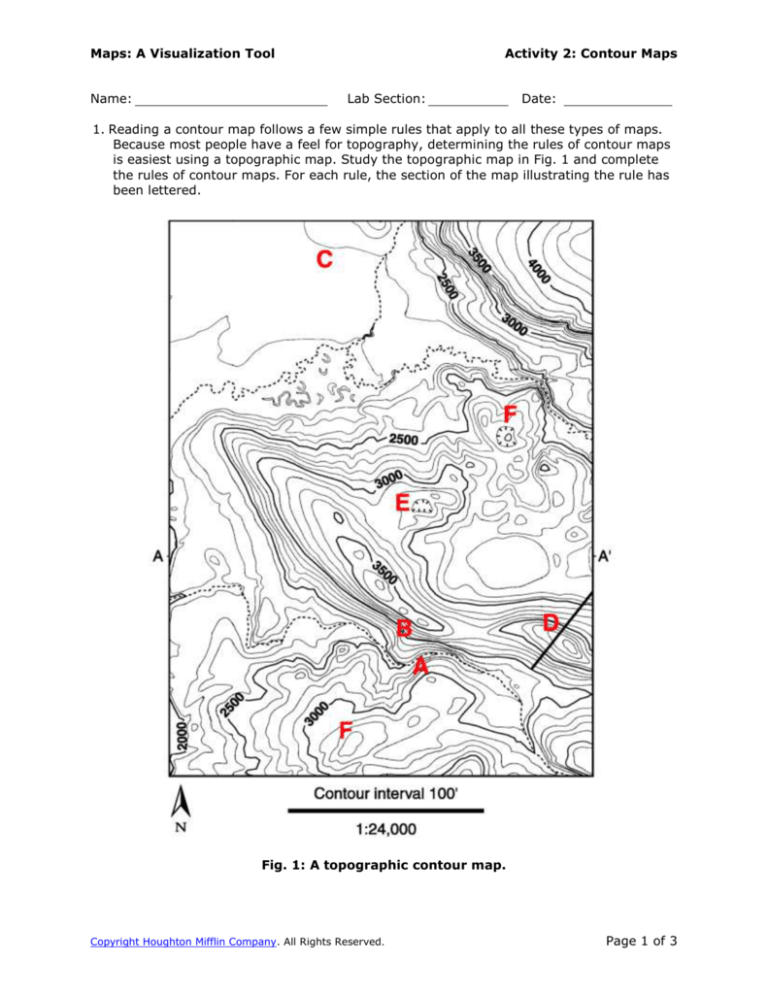
1. Reading a contour map follows a few simple rules that apply to all these types of maps.
Because most people have a feel for topography, determining the rules of contour maps
is easiest using a topographic map. Study the topographic map in Fig. 1 and complete
the rules of contour maps. For each rule, the section of the map illustrating the rule has
been lettered.
Fig. 1: A topographic contour map.
Copyright Houghton Mifflin Company. All Rights Reserved.
Page 1 of 3
Maps: A Visualization Tool
Activity 2: Contour Maps
a. Contours point or make a V shape in the
stream direction [ A ].
b. Closely grouped contours indicate
slopes [ B ].
c. Widely spaced contours indicate
slopes [ C ].
d. If your hike over the top of a hill, you will cross the same/different (circle one)
contours on opposite sides of the summit [ D ].
e. Contours can/cannot (circle one) touch or cross.
f. Depressions are enclosed by
side of the contour [ E ].
on the uphill/downhill (circle one)
g. Contours can/cannot (circle one) split.
h. Closed contour lines indicate a
or a
i. Points on one side of a contour line are
than points on the other side.
[ F ].
or
2. Plotted on the map in Fig. 2 are the results of a topographic survey. Each point is a
position where the elevation has been determined. The points are labeled with their
height in meters. Dashed lines represent streams or rivers. Use these data points to
construct a topographic map of the area.
a. Determine the maximum and minimum elevations in the map area. Enter your
results below.
Minimum:
Maximum:
b. Using a contour interval of 10 m, determine the contour lines necessary to
accommodate the maximum and minimum elevations. Enter your results below (note
that there may not be contour lines to fill all the blanks).
c. Start drawing your contours in the southwest corner of the map. Use the rules of
contours to draw your contour lines correctly. Make your map as realistic as possible.
After drawing two contour lines completely across your map, have your instructor
check your work before you proceed further.
Copyright Houghton Mifflin Company. All Rights Reserved.
Page 2 of 3
Maps: A Visualization Tool
Activity 2: Contour Maps
Fig. 2: The results of a topographic survey.
Follow this link to a Java applet that will help you with this contour map.
2. Using the topographic map provided by your instructor for Activity 2, answer the
following questions.
a. The map has a contour interval of
b. The elevation at point A is
c. Is the slope at point B steep or gentle?
d. The maximum elevation on the map is
e. The minimum elevation on the map is
f. This map has a total relief of
g. The local relief at point C is
h. Calculate the gradient along line D.
i. Express this gradient as the fall in feet per mile.
Copyright Houghton Mifflin Company. All Rights Reserved.
Page 3 of 3


