Appendix (Supplementary Material)
advertisement
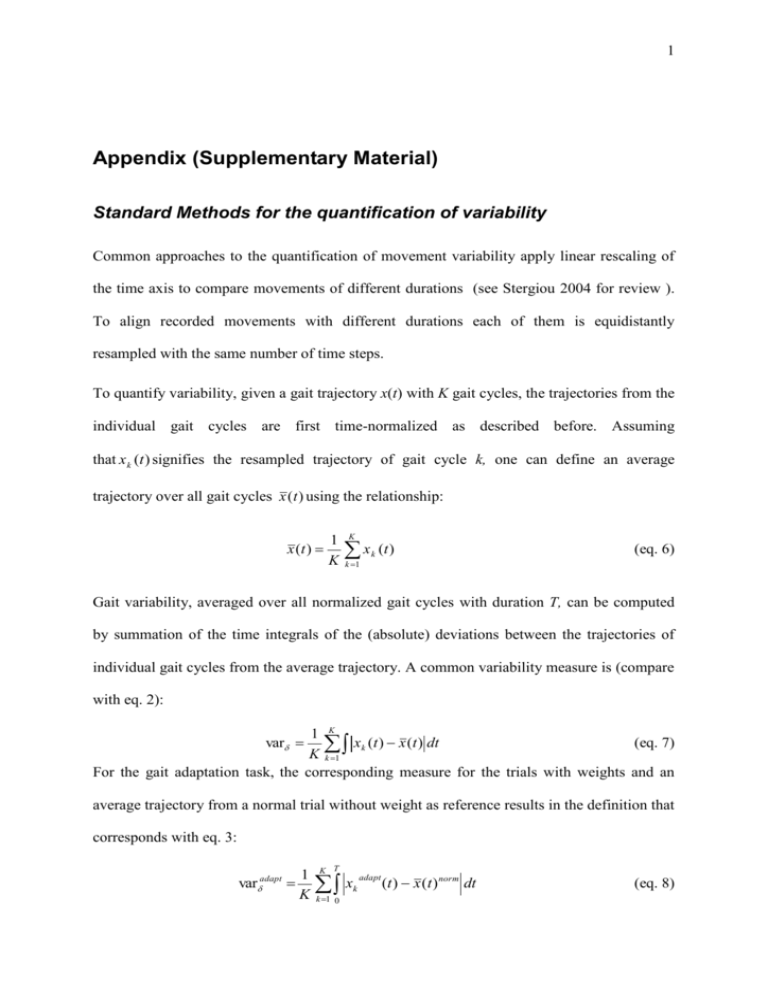
1 Appendix (Supplementary Material) Standard Methods for the quantification of variability Common approaches to the quantification of movement variability apply linear rescaling of the time axis to compare movements of different durations (see Stergiou 2004 for review ). To align recorded movements with different durations each of them is equidistantly resampled with the same number of time steps. To quantify variability, given a gait trajectory x(t) with K gait cycles, the trajectories from the individual gait cycles are first time-normalized as described before. Assuming that x k (t ) signifies the resampled trajectory of gait cycle k, one can define an average trajectory over all gait cycles x (t ) using the relationship: x (t ) 1 K K x k (t ) (eq. 6) k 1 Gait variability, averaged over all normalized gait cycles with duration T, can be computed by summation of the time integrals of the (absolute) deviations between the trajectories of individual gait cycles from the average trajectory. A common variability measure is (compare with eq. 2): 1 K (eq. 7) xk (t ) x (t ) dt K k 1 For the gait adaptation task, the corresponding measure for the trials with weights and an var average trajectory from a normal trial without weight as reference results in the definition that corresponds with eq. 3: adapt var 1 K K T x k 1 0 adapt k (t ) x (t ) norm dt (eq. 8) 2 The corresponding adaptation index is given by (cf. eq. 4): adapt I varadapt (trial1 ) varadapt (trial3 ) varadapt (trial1 ) (eq. 9) For the pure spatial difference measure vbδadapt there is no significant difference between first and third trial for any patient group and no significant difference in the corresponding adaptation index Iδadapt, indicating that temporal aspects of intra-limb coordination in particular play a critical role in adaptation. Computation of spatio-temporal correspondence A systematic method for the modeling of trajectory sets with spatial and temporal differences is based on establishing spatio-temporal correspondence between different movement trajectories (Giese and Poggio 2000). A point xtest(tn) on the test trajectory, which corresponds to the point xref(tn) on the reference trajectory, is shifted in space by the spatial vector (tn), and by the (scalar) time shift (tn). More formally, this can be described by the relationship: x test (t ) x ref (t ) (t ) t t (t ) (eq. 10) The functions(t) and (t) describe the spatial and the temporal deviation of the test trajectory from the reference trajectory, for each point t in time. Our correspondence algorithm determines these functions by minimizing an error functional that is given by a weighted sum of the time integrals of the squared spatial and temporal displacements: E , (t ) λ (t )2 dt 2 (eq. 11) The positive constant λ determines the relative contributions of spatial and temporal shifts to this error. Large values of λ lead to solutions without temporal shifts (i.e. without time 3 warping), whereas small values of λ favour solutions with large temporal shifts (Figure 9). For all analyses in this study, the parameter λ was normalized dependent on the maximum of the spatial amplitudes of the trajectories max(xref,xtest) according to the relationship: c d 2 max( x ref , xtest ) (eq. 12) The constant factor was set to c = 0.001, d denotes the dimensionality of the trajectories. This computation of λ has been adequate for the representation of spatio-temporal movement characteristics in previous applications for the analysis and synthesis of human movement (Giese and Poggio 2000; Ilg et al. 2004; Ilg et al. 2003). For the angle trajectories of hip and knee Eq. 12 results (with d=2 and taking into account the normalization of the angle values within the interval [0,1], see Methods) in a value of λ=0.004. In order to verify that the performance of our algorithm is not critically dependent on the actual choice of lambda, we tested the temporal variability of joint coordination in the leg placement task for a large range of lambda values. For this range of lambdas [0.01:0.0001], the rank ordering of patients was highly preserved, as reflected in rank-order correlations across lambdas (r≥0.938, p ≤0.00001). This indicates that the choice of lambda in this range do not change the presented results. The minimization of the error function (eq. 11) has to be accomplished under the constraints that the new time axis t’ never runs backwards in order to ensure the uniqueness of the correspondence. This is equivalent to the constraint ’(t) ≥ 0. Optimization with this inequality constraint was accomplished by dynamic programming, resulting in an algorithm known as dynamic time warping (Bruderlin and Williams 1995; Rabiner and Juang 1993). More details about the correspondence algorithm can be found in (Giese and Poggio 2000). 4 Specifity of impairments in the adaptation of intra-limb coordination In order to verify that our results were not induced by confounding factors, we performed various tests: there was no significant correlation (p ≥ 0.15) between the adaptation index Iτadapt and the total ICARS clinical ataxia score or any subscores. Therefore the adaptation performance seems not to be correlated with the general degree of ataxia. In addition, the adaptation index was not significantly correlated with age, neither in the control subjects nor in the patients with cerebellar lesions (r≤ 0.16, p ≥ 0.59). Another set of statistical analyses controls for possible influence of confounding parameters on the observed variability changes. Previous studies indicate that gait variability depends on gait velocity (Borghese et al. 1996; Jordan et al. 2006; Winter 1983). A potential confounding influence of this parameter is ruled out by the fact that the correlations between the temporal variability measure vbτadapt and velocity were nonsignificant for controls (r = -0.2, p = 0.533), patients (r = -0.46, p = 0.12), and for all subjects together (r = -0.12, p = 0.57). In addition, the temporal variability of joint coordination vbτadapt did not significantly correlate with the intra-subject variability of walking speed (step cycle by step cycle) for neither subject group (r ≤ 0.28, p ≥ In order to further examine the influence of gait velocity on the adaptation of intra-limb coordination pattern in the patient sample we performed a univariate ANCOVA with the adaptation index as independent variable (see Methods). The overall ANCOVA model was significant (F2,12 = 5.39, p = 0.029). Patient group classification (ILP/NILP) did have a significant effect on adaptation index (F1,12 = 8.78, p = 0.016), whereas velocity did not (F1,12 = 5.39, p= 0.57). 5 Comparing both legs, we found significantly higher values of the measure vbτadapt for the impaired leg than for the unimpaired leg, both for the IL patients (t10 = 3.2, p=0.004) and for the group of all patients (CP) (t22 = 2.0, p = 0.03). These results indicate that the adaptation of intra-limb coordination patterns is effected by cerebellar dysfunctions and not predominantly influenced by differences in general gait characteristics such as velocity. Dependence on the maturation within the cerebellum Some of the tested subjects were young adolescents. Thus, one might argue that our data might be confounded by different degrees of maturity of the central nervous system (CNS) of our participants. Although the exact time course of myelinization is presently unknown, myelinization of the cerebellum continues at a slow rate most likely up to young adulthood (Pfefferbaum et al. 1994). Older parts of the cerebellum (i.e., archi- and paleocerebellum), however, are thought to finish myelinization earlier than newer parts (i.e., neocerebellum) (Jernigan and Tallal 1990). Given that the intermediate zone receives both spino- and cerebrocerebellar afferences, our findings might be confounded by ongoing maturation of the CNS. It seems unlikely that such a potential bias had a strong influence on our results, since we used age-matched healthy controls. In this group the results should be equally biased by ongoing maturation. Furthermore, the parameter used for categorization in (IL/NIL, IB/NIB) and the adaptation index were not significantly correlated with age, neither in the control subjects nor in the patients (r≤0.23, p≥0.46). Finally, a previous study of our group showed that age at surgery did not correlate with outcome of postural and upper limb ataxia in children and adolescents with cerebellar tumours (Konczak et al. 2005). Motor outcome was determined by lesions of the relevant cerebellar nuclei but not by age at the time of surgery (age range at surgery 1-17 years). Therefore, even though there might exists an influence of 6 the ongoing myelinization in subjects below the age of 16 years, it appears unlikely this factor has significantly biased the results of our study. Figure 1 Illustration of the relationship between temporal and spatial shifts for different values of λ. Joint angle trajectories and the computed spatio-temporal average trajectory are shown. Thin lines between the trajectories connect points that are in spatio-temporal correspondence. Higher values of λ lead to solutions with less temporal shifts, whereas small values of λ favour solutions with large temporal shifts. Vertical connection lines mean only spatial and no temporal displacements (label 1). Horizontal connections mean pure temporal displacements (label 2).


