microscopy interactions
advertisement
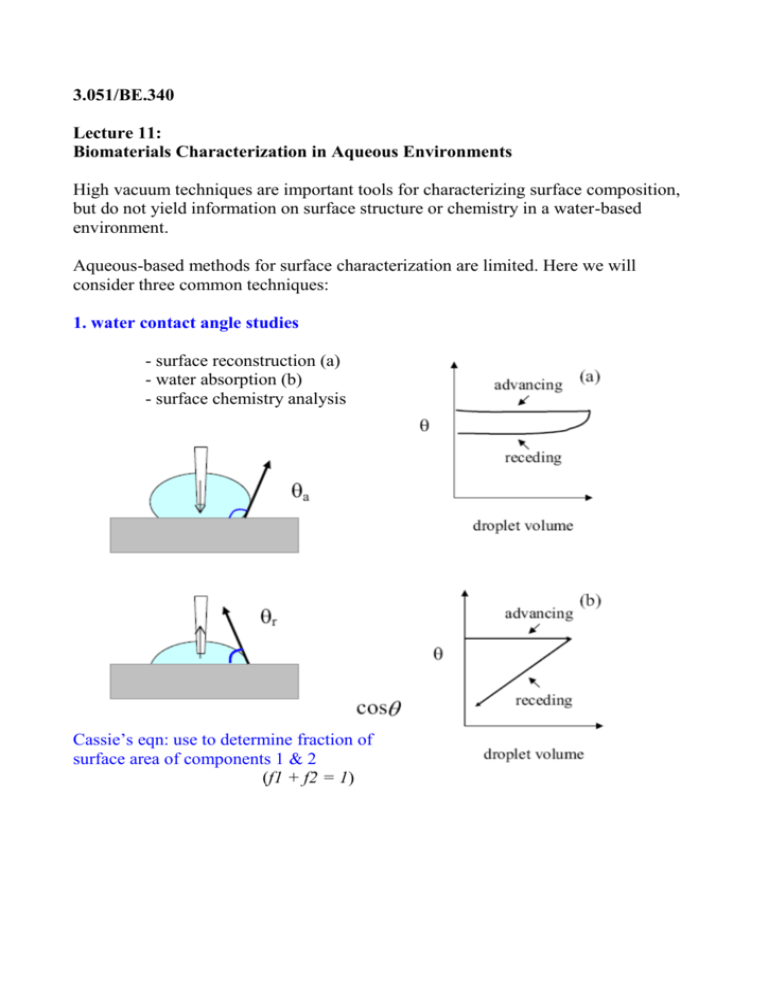
3.051/BE.340 Lecture 11: Biomaterials Characterization in Aqueous Environments High vacuum techniques are important tools for characterizing surface composition, but do not yield information on surface structure or chemistry in a water-based environment. Aqueous-based methods for surface characterization are limited. Here we will consider three common techniques: 1. water contact angle studies - surface reconstruction (a) - water absorption (b) - surface chemistry analysis Cassie’s eqn: use to determine fraction of surface area of components 1 & 2 (f1 + f2 = 1) 3.051/BE.340 2. in situ ellipsometry - degree of hydration of a film Ellipsometric angles Ψ and Δ ⇒thickness (df ) & refractive index (nf) ( 3-layer model) 3.051/BE.340 3. Atomic Force Microscopy (or Surface Force Microscopy): imaging method that exploits intermolecular interactions between a small (~atomic) probe and molecules on surface 3.051/BE.340 Operation Modes 1. Contact mode (short-range) ► Tiny cantilever deflections detected by photodiode array ►Tip rastered over sample surface at fixed force (via photodetectorzpiezo feedback loop) generates topographical image ⇒analogous to stylus on a record player ►Good for hard samples; can drag soft materials! force applied: nN x-y resolution: 1Å z resolution: < 1Å Image removed due to copyright considerations. See Fig. 10 in Jandt, Klaus D. "Atomic force microscopy of biomaterials surfaces and interfaces." Surface Science 491 (201): 303-332. Contact mode images of TiO2 (rutile) film surface ►No contrast at low resolution— flat surface ►High resolution—atoms of (001) plane are revealed 3.051/BE.340 2. “Tapping” mode ►Tip oscillates in z-axis at high ω (~50-500 kHz in air, 10 kHz in fluids) with intermittent sample contact ⇒ eliminates shear forces ► Interactions between tip and sample cause amplitude attenuation (driven amplitude ~ 10 nm) ► Cantilever deflections used in feedback loop to maintain average applied force similar to contact mode oscillatory amplitude attenuation ⇒ “height” data ►Commonly used for soft samples, aqueous environments x-y resolution: 1-2 nm Tapping mode images in air (left) and water (below) of laminin (Ln1) adsorbed onto mica. ►Cruciform molecular shape ► “Arms” can bend and fold Image removed due to copyright considerations. Image removed due to copyright considerations. Figure 1 and Figure 6 from C.H. Chen, D.O. Clegg & H.G. Hansma, Biochemistry 37, 1998, 8262. 3.051/BE.340 3. Phase imaging (in conjunction with tapping mode) ► Tip oscillated in z-axis, making intermittent sample contact ► Simultaneous measurement of amplitude attenuation & phase lag of cantilever signal vs. signal sent by piezo-driver oscillation amplitude attenuation ⇒“height” data oscillation phase-shift ⇒ “elasticity” map AFM image of polystyrene-bpoly( lauryl methacrylate) block copolymer film. ←Height data: variation in film thickness seen at polymer droplet edge Image removed due to copyright considerations. Phase data: microdomains of soft ← PLMA block (Tg~-35C) and hard PS block (Tg~100C) are distinguished Figure 6 from M.J. Fasolka et al., Macromolecules 33, 2000, 5702. 3.051/BE.340 3. Force modulation mode ►Tip oscillates in z-axis at ω<ω。= (k/m)¹”² (cantilever resonance frequency), making intermittent sample contact; ω~3-120kHz. ► Interactions between tip and sample cause amplitude attenuation ► Contact force applied to sample is modulated, giving elasticity information cantilever deflection amplitude ⇒ “elasticity” map 4. Non-contact AFM ► Oscillation near resonance frequency without tip-surface contact (long-range forces in U(r) curve; r > 0.6 nm, typical F <1 pN) ►Force gradients from surface interactions shift resonance frequency ► Force gradients used to map secondary interactions ( d i fficult in fluids due to damping; good for soft samples) resolution: dF/dz ~ 10 �N/m (0.1 pN at a gap of 1 nm) 3.051/BE.340 5. Force-Distance Profiles ►As sample is brought towards surface, measured force: ΔF = kΔzc (Δzc = cantilever deflection) D > 10 nm hydrophobic interactions, electrostatic interactions, steric repulsion of polymer “brush” layer D < 10 nm van der Waals attraction ► Obtain F(z) of species w/ surface by coating tip with receptor, antibody, ligand, colloid, cell, etc. - jump to contact seen for (i) - further approach bends cantilever (ii) - on retraction, tip “sticks” from adhesion forces (iii) after S.C. Olugebefola et al., Langmuir 18, 2002, 1098. 3.051/BE.340 ► Measure height of hydrated surface layer via nonlinear regimes Sample height interval:Δzs = zs,jΔzs,j-1 Force increment from cantilever deflection:ΔF≡ kΔzc Sample deformation: Δzs -Δzc 3.051/BE.340 Biomaterials-relevant SFM/AFM Studies ► protein adsorption ► cell membrane integral proteins ► initiation of clot formation ► hydrated surface layers ► chemical mapping ► ligand-receptor interactions ► cell adhesion ► surface charge mapping ► surface topography ► surface elasticity ► protein structure (single chain expts)… References C.A. Siedlecki and R.E. Marchant, “AFM for characterization of the biomaterial interface”, Biomaterials 19 (1998), 441-454. K.D. Jandt, “Atomic force microscopy of biomaterials surfaces and interfaces”, Surface Science 491 (2001), 303-332. S. Kidoaki and T. Matsuda, “Mechanistic aspects of protein/material interactions probed by atomic force microscopy”, Colloids and Surfaces B: Biointerfaces 23 (2002) 153-163.

