Appendix A
advertisement
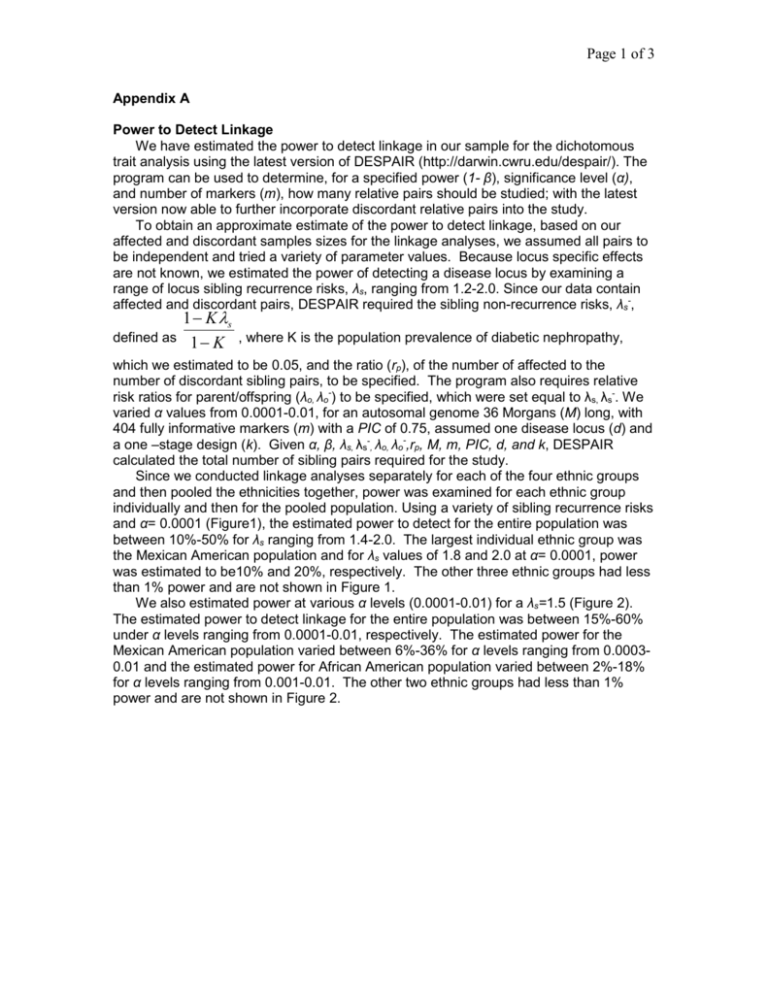
Page 1 of 3 Appendix A Power to Detect Linkage We have estimated the power to detect linkage in our sample for the dichotomous trait analysis using the latest version of DESPAIR (http://darwin.cwru.edu/despair/). The program can be used to determine, for a specified power (1- β), significance level (α), and number of markers (m), how many relative pairs should be studied; with the latest version now able to further incorporate discordant relative pairs into the study. To obtain an approximate estimate of the power to detect linkage, based on our affected and discordant samples sizes for the linkage analyses, we assumed all pairs to be independent and tried a variety of parameter values. Because locus specific effects are not known, we estimated the power of detecting a disease locus by examining a range of locus sibling recurrence risks, λs, ranging from 1.2-2.0. Since our data contain affected and discordant pairs, DESPAIR required the sibling non-recurrence risks, λs-, 1 K s defined as 1 K , where K is the population prevalence of diabetic nephropathy, which we estimated to be 0.05, and the ratio (rp), of the number of affected to the number of discordant sibling pairs, to be specified. The program also requires relative risk ratios for parent/offspring (λo, λo-) to be specified, which were set equal to λs, λs-. We varied α values from 0.0001-0.01, for an autosomal genome 36 Morgans (M) long, with 404 fully informative markers (m) with a PIC of 0.75, assumed one disease locus (d) and a one –stage design (k). Given α, β, λs, λs-, λo, λo-,rp, M, m, PIC, d, and k, DESPAIR calculated the total number of sibling pairs required for the study. Since we conducted linkage analyses separately for each of the four ethnic groups and then pooled the ethnicities together, power was examined for each ethnic group individually and then for the pooled population. Using a variety of sibling recurrence risks and α= 0.0001 (Figure1), the estimated power to detect for the entire population was between 10%-50% for λs ranging from 1.4-2.0. The largest individual ethnic group was the Mexican American population and for λs values of 1.8 and 2.0 at α= 0.0001, power was estimated to be10% and 20%, respectively. The other three ethnic groups had less than 1% power and are not shown in Figure 1. We also estimated power at various α levels (0.0001-0.01) for a λs=1.5 (Figure 2). The estimated power to detect linkage for the entire population was between 15%-60% under α levels ranging from 0.0001-0.01, respectively. The estimated power for the Mexican American population varied between 6%-36% for α levels ranging from 0.00030.01 and the estimated power for African American population varied between 2%-18% for α levels ranging from 0.001-0.01. The other two ethnic groups had less than 1% power and are not shown in Figure 2. Page 2 of 3 Figure 1. Estimated power to detect linkage for the entire population and Mexican American population using a range of λs values and α= 0.0001. 0.5 All Ethnicities Combined Mexican Americans 0.4 Power 0.3 0.2 0.1 0.0 1.2 1.4 1.6 Sibling Recurrence Risk 1.8 2.0 Page 3 of 3 Figure 2. Estimated power to detect linkage for the entire population, Mexican American population, and African American population using a range of α levels (0.0001-0.01) for a λs=1.5. 0.7 All Ethnicities Combined Mexican Americans African Americans 0.6 Power 0.5 0.4 0.3 0.2 0.1 0.0 4.0 3.5 3.0 Significance Level -log (Significance Level) 2.5 2.0

