The Australian Government IPS Radio and Space Services Web site
advertisement
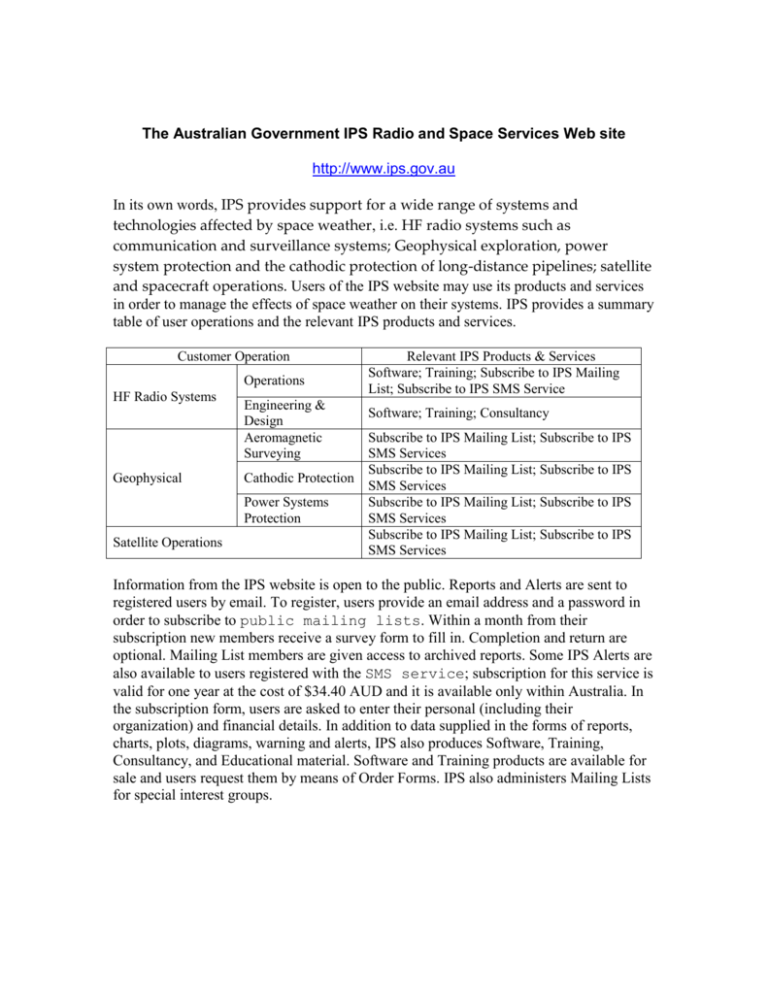
The Australian Government IPS Radio and Space Services Web site http://www.ips.gov.au In its own words, IPS provides support for a wide range of systems and technologies affected by space weather, i.e. HF radio systems such as communication and surveillance systems; Geophysical exploration, power system protection and the cathodic protection of long-distance pipelines; satellite and spacecraft operations. Users of the IPS website may use its products and services in order to manage the effects of space weather on their systems. IPS provides a summary table of user operations and the relevant IPS products and services. Customer Operation Operations HF Radio Systems Geophysical Engineering & Design Aeromagnetic Surveying Cathodic Protection Power Systems Protection Satellite Operations Relevant IPS Products & Services Software; Training; Subscribe to IPS Mailing List; Subscribe to IPS SMS Service Software; Training; Consultancy Subscribe to IPS Mailing List; Subscribe to IPS SMS Services Subscribe to IPS Mailing List; Subscribe to IPS SMS Services Subscribe to IPS Mailing List; Subscribe to IPS SMS Services Subscribe to IPS Mailing List; Subscribe to IPS SMS Services Information from the IPS website is open to the public. Reports and Alerts are sent to registered users by email. To register, users provide an email address and a password in order to subscribe to public mailing lists. Within a month from their subscription new members receive a survey form to fill in. Completion and return are optional. Mailing List members are given access to archived reports. Some IPS Alerts are also available to users registered with the SMS service; subscription for this service is valid for one year at the cost of $34.40 AUD and it is available only within Australia. In the subscription form, users are asked to enter their personal (including their organization) and financial details. In addition to data supplied in the forms of reports, charts, plots, diagrams, warning and alerts, IPS also produces Software, Training, Consultancy, and Educational material. Software and Training products are available for sale and users request them by means of Order Forms. IPS also administers Mailing Lists for special interest groups. 1. The IPS Reports and Alerts service covers the following subjects: Solar Conditions o Solar Wind Speed o X Ray Flux and Flares o Latest Culgoora Spectrograph and H-Alpha Image Geophysical Conditions o Geomagnetic Warning o K and pc3 Indices o GEOSTAT, Geomagnetic and Aurora Alerts HF Propagation Conditions o HF Communications and HF Fadeout Warning o Current HF Fadeout o Polar Cap Absorption Ionospheric Conditions in Australasia, North America and Europe. TEC Conditions in Australasia, North America, Europe and Japan. 2. The IPS Mailing Lists are divided into the following groups and sub-groups: Alerts o Possibility of Auroral Event. Notification of times when aurorae are more likely to be seen at more equatorial latitudes than it is normal. o Magnetic Alert. Notification of a geomagnetic disturbance where the planetary K index is greater than 5. Alerts also provide notification of pc3 pulsation index greater or equal to 5. o Geomagnetic Sudden Impulse Detection. Experimental product provides an alert service for sudden impulse events in the geomagnetic field. Impulses are arbitrarily classified as Weak (<50nT), Moderate (>50nT & <100nT) and Strong (>100nT). o Flare Alert. Notification of an X Ray Solar Flare event of intensity larger than M5. o SWF Alert. Notification of a Short Wave Fadeout in the Australian region. o Proton Alert. Notification of the occurrence of a proton event o Radio Sweep events detected at Culgoora o GEOSTAT System (GEOmagnetic STorm Alert Tracking) System provides 6 alerts issued at different stages along the passage of a solar event from its origin to its impact as a geomagnetic storm. o Solar Wind Shock Alert. Experimental product, not totally reliable. Solar wind data are correlated with a step function to determine a shock. Shocks are arbitrarily classified as Weak (Velocity Change <60km/sec), Moderate (60< V.C. <120km/sec) and Strong (V.C. >120km/sec). o Solar Wind geomagnetic activity precursor Alert. Experimental product not totally reliable. Notification when the Flux levels of an ACE satellite 65-112KeV data channel points to forthcoming solar wind shocks and geomagnetic storm activity. Warnings o Geophysical Warning. Forecasts significant levels of geomagnetic activity in the Australian region o HF Warning. Forecasts disturbed ionospheric conditions in both the Australian and New Zealand regions, and offers relevant management advice. Daily Reports o Daily HF Propagation Report. A 1-day summary and 3-day forecast of HF propagation and ionospheric conditions in the Australian region. o Daily Solar and Geophysical Report. A 1-day summary and 3-day forecast of solar and geomagnetic activity, global HF propagation conditions and ionospheric conditions in the Australian region. o Automated Daily European HF Propagation Report. A 1-day summary and forecast ionospheric conditions for the European region. Ionospheric foF2 real-time data are supplied by the National Institute of Geophysics in Rome, Rutherford Appleton Laboratory (ionosonde group) in England, the Swedish Institute of Space Physics and the Institute of Space Application and Remote Sensing in Athens. A real-time European T Index is produced from these data as well. This is combined with both estimated and forecast A Index information from the Space Environment Centre in Boulder USA. The two of these together make up an automated summary and forecast of European regional HF conditions. The report is issued at 6:30UT daily. o Daily Quiet Sun Radio Fluxes from Learmonth. Measurements of Quite Sun Radio Flux are taken at a number of fixed frequencies. The report includes interpolated values at frequencies of interest to IPS customers. Each measurement has a quality indicator to distinguish values which may be affected by radio burst from the sun. Weekly Reports o Weekly Geophysical Report. A 1-week summary and 1-month forecast of geomagnetic activity in the Australian region. o Weekly HF Propagation Report. A 1-week summary and forecast of HF propagation and ionospheric conditions. Also, a 1-month outlook for disturbed HF propagation conditions for the Australian region. o Weekly Solar and Geophysical Report. A 1-week summary and forecast of solar activity, geomagnetic activity and ionospheric conditions in the Australian region. Monthly Reports o Observed and Predicted Solar Indices. A table of observed, estimated and predicted values for the smoothed sunspot number. It is usually issued soon after the start of a calendar month. o IPS Observed and Predicted T Indices. A table of observed and predicted values for the IPS T-Index, which is input to the IPS HF frequency prediction program ASAPS. Issued soon after the start of a calendar month. o Monthly Solar and Geophysical Report. A monthly summary of solar, geomagnetic and ionospheric activity, updated T-indices and information detailing the progress of the current solar cycle. The report includes articles of general interest on the solar-terrestrial environment and its effects on various technical systems. Discussion groups o Ionosonde Network Advisory Group. (INAG) A Moderated Mail List hosted on IPS computers; newcomers must email the List Moderator in order to become members. The group’s responsibilities are the collection of information on the analysis of ionogramsas well as the maintaining of conventions for the reduction of ionograms. The List provides a forum for people interested in obtaining reliable data from ionograms and preserving the global ionospheric climate record. Through this, it broadens the scope of INAG. It is also a communication channel between the INAG officers and the List members. o Australian radio science general mail list. A Moderated Mail List hosted on IPS computers; newcomers must email the List Moderator in order to become members. The National Committee for Radio Science (NCRS) aims to liaise with URSI (Union of Radio Science) and other relevant national and international bodies and societies, to propose and encourage activities in Australia jointly or separately, and to keep the body of URSI in touch with its community. o URSI Commission G Mailing List. The List is used for advertising the forthcoming URSI General Assembly and to keep members up to date with commission G activities. o Ionospheric Research Mailing List. Established to support the work of URSI Working Group 4, it intends to cover a wide range of systems likely to be affected by ionospheric effects. The purpose of the List is to create a communication channel for people interested in the activities of WG4, and, as a result, broaden the scope of WG4 itself; also, to facilitate the contact between the WG4 Officers and the List members. 3. The SMS Service delivers the following Alerts messages: Short Wave Fadeout Alert (SWF) Auroral Alerts Geomagnetic Alert GEOSTAT System 4. Two pieces of IPS Software are available to order: ASAPS (Advanced Stand Alone Prediction System) predicts sky wavy communication conditions in the HF or VHF radio spectrum of Short Wave band (1 to 45 MHz). It is based on an ionospheric model developed by IPS. Sale price is set to $375 AUD, or $275 USD, or €240. GWPS is a program for estimating Ground Wave Range values under specified ground and operation conditions. It is a stand-alone program that runs on any DOS system with graphics capability. Both are available for sale, priced differently according to geographical location. It costs $54 AUD, or $35 USD, or €34. 5. IPS Training material available to order: ASAPS training courser, on the different prediction types and navigating within ASAPS. The course is 1-day long and costs $150AUD. HF Radio course, on HF Radio Propagation. The course is 1-day long and costs $190AUD per person. HF Radio Manual is a complete introduction to the ionosphere, HF radio propagation and solar terrestrial activity. It costs between $25 and $30 AUD worldwide. 6. Consultancy IPS provides specialist consulting services to support the design of new HF radio systems and networks or the re-configuration of existing ones. Their range of information and support includes: Area of coverage charts and propagation analysis across HF networks Frequency Management Software for integration into users’ systems Ionogram auto-scaled software HF Antenna modeling and footprints. 7. Client Support ISP provides customized products to the following companies/ organizations: Airservices Australia o Hourly HAP Charts State Emergency Service o HAP of communication frequencies based on current observed conditions from Bathurst, Bourke, Dubbo, Goonellabah, Goulburn, Grafton, Gunnedah, Lavington, Lord Howe Island, Metford, Moree, Parkes, Singleton, Sydney, Taree, Wagga Wagga and Wollogong AMSA o Hourly HAP Charts from Chralville and Wiluna RECOM o Hourly HAP Charts Australian Antarctic Program o Hourly HAP Charts from Casey, Commonwealth Bay, Hobart and Macquarie Island) Virgin Blue o Hourly, Daily and Monthly HAP Charts from Brisbane o Route Prediction Display, an interactive tool that accepts user input and displays a route prediction 8. The Educational Service IPS offers open access to articles by IPS staff, on Space Weather, the Sun and Solar Activity, the Earth’s Magnetic Field, Space Debris and other topics. A Glossary of Solar Terrestrial Terms is also available. 9. World Data Centre IPS operates the World Data Centre (WDC) for Solar-Terrestrial Science (STS), in Sydney. The Centre provides Solar and Ionosonde data as well as Space Physics Interactive Data Resources (SPIDR). The latter is available to registered users only; to register, users are asked to supply their name, email and country. The Data Catalogues cover the subjects of: Solar Data (past, current and future) ° Ionosonde Data (from all Australian ionospheric stations) ° Magnetometer Data (from all Australian magnetometer stations) ° Riometer Data (for the Australian Antarctic stations from 1987 to 2003) ° Spectrograph Data (from the station of Calgoora) ° GPS Data (from the stations of Vanimo and Port Moresby) The Data Display Tools are: o Magnetogram Graph is an interactive tool that accepts user input (selections from drop-down lists) of Station, Date and Components. For instance, the magnetogram for the station of Canberra in 08/05/2004 with h and d components is captured here. Users are also given the choice of downloading the relevant data into a comma-separated file. o Ionospheric Data – Hourly is an interactive tool that accepts user input of Station Parameter (foF2, M(3000)F2, h’F2, foF1, h’F, foE, h’E, foEs, fbEs, h’Es, fmin, fxl) and Date and displays Iondata and Line Graph. For instance, the hourly foF2 graph for the station of Mawson in 22/04/2003 is captured here. Users are also given the choice of downloading the relevant data into a comma-separated file. o Medians is an interactive tool that accepts user input of Median (foF2 or M(3000)F2), Station(s) (either in Australasia & Antarctica, or Asia, or Europe, or America, or Africa) and Date and displays Media and Line Graph. For instance, the Median from Tromso of foF2 in August 1978 is captured here. Users are also given the choice of downloading the relevant data into a comma-separated file. o Spectrograph Accepts user input of Station and Date and displays Spectrograph Graph or downloads retrieved data in a comma-separated file. The rest of the IPS website content is divided into four areas of Satellite, Geophysical, Solar and HF Systems. Information in these areas is publicly available and involves maps, graphs, plots, reports and interactive tools.
