Lab #10 Transducers - Northern Arizona University
advertisement
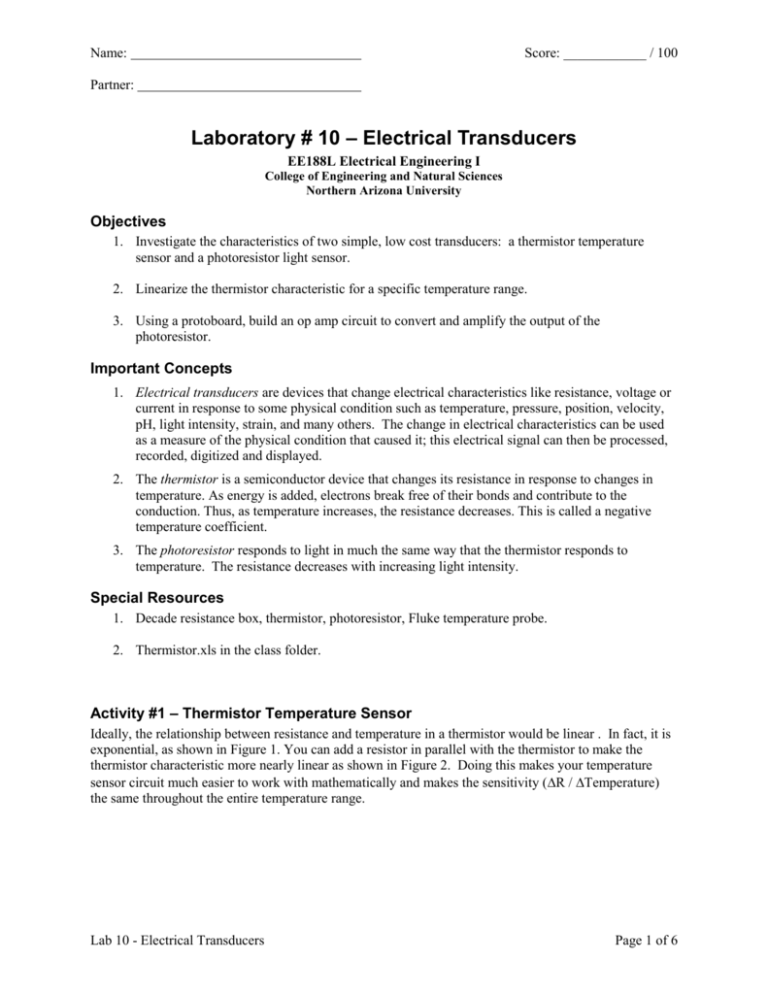
Name: Score: ____________ / 100 Partner: Laboratory # 10 – Electrical Transducers EE188L Electrical Engineering I College of Engineering and Natural Sciences Northern Arizona University Objectives 1. Investigate the characteristics of two simple, low cost transducers: a thermistor temperature sensor and a photoresistor light sensor. 2. Linearize the thermistor characteristic for a specific temperature range. 3. Using a protoboard, build an op amp circuit to convert and amplify the output of the photoresistor. Important Concepts 1. Electrical transducers are devices that change electrical characteristics like resistance, voltage or current in response to some physical condition such as temperature, pressure, position, velocity, pH, light intensity, strain, and many others. The change in electrical characteristics can be used as a measure of the physical condition that caused it; this electrical signal can then be processed, recorded, digitized and displayed. 2. The thermistor is a semiconductor device that changes its resistance in response to changes in temperature. As energy is added, electrons break free of their bonds and contribute to the conduction. Thus, as temperature increases, the resistance decreases. This is called a negative temperature coefficient. 3. The photoresistor responds to light in much the same way that the thermistor responds to temperature. The resistance decreases with increasing light intensity. Special Resources 1. Decade resistance box, thermistor, photoresistor, Fluke temperature probe. 2. Thermistor.xls in the class folder. Activity #1 – Thermistor Temperature Sensor Ideally, the relationship between resistance and temperature in a thermistor would be linear . In fact, it is exponential, as shown in Figure 1. You can add a resistor in parallel with the thermistor to make the thermistor characteristic more nearly linear as shown in Figure 2. Doing this makes your temperature sensor circuit much easier to work with mathematically and makes the sensitivity (R / Temperature) the same throughout the entire temperature range. Lab 10 - Electrical Transducers Page 1 of 6 30k Resistance ohms Resistance ohms 40k o 20k o 10k 9k 7k 5k 3k o o 0 30 40 50 60 70 Temperature in 0 F 80 90 100 Figure 1. Uncompensated Thermistor 30 40 50 60 70 Temperature in 0 F 80 90 100 Figure 2. Ideal Thermistor The following is a mathematical approximation of the relationship between resistance and temperature with values given for our thermistor: R = R0e (1/TK - 1/T0) where and and R = resistance at TK (units of K) R0 = 10 k at T0 = 298 K = curve-fitting constant = 4200 (1) Solving equation (1) for TK and substituting the values given for the thermistor results in: TK = 4200° Kelvin 4.8836 + ln R (2) Temperatures on the Kelvin scale (TK) can then be converted to Fahrenheit (TF) as follows: TF = 1.8(TK - 273°) + 32° Fahrenheit (3) 1. First, obtain a thermistor and let it stabilize at room temperature for about one minute and then measure its resistance with the Digital Multimeter, set for M (medium speed). The thermistor’s resistance should be between 8 and 12 k. Hold the body of the thermistor between your fingers for a minute and then measure the resistance again before letting go. Using equations (2) and (3), convert the resistance measurements made to Kelvin and Fahrenheit temperatures. Resistance ohms Temperature Degrees Kelvin Temperature Degrees Fahrenheit Thermistor at room temp Thermistor between fingers 2. Measure and record both the Fahrenheit room temperature and the temperature between your fingers with the Fluke Universal Temperature Probe (turn the probe switch OFF when finished). This probe uses a semiconductor junction to measure temperature and provide a DC output voltage at the scale factor of 1 mV per degree; the probe plugs directly into the input of the DMM in the same holes normally used for making voltage measurements. The specification sheet provides more detailed information on the operation of this device. Lab 10 - Electrical Transducers Page 2 of 6 3. Use the Excel spreadsheet "Thermistor.xls" in the class folder to find the optimum parallel compensation resistor for your thermistor. Start the program by opening up your electronic lab class folder and copy the file named "Thermistor.xls" to your directory. Double-click the file to launch the program in Excel. Enter a value for the compensating resistor in the cell with red numbers and observe the results in the plot of the parallel resistance (Rp) versus temperature. The column entitled "Calculated °F" is based on a straight line connecting the two end points of the resistance data, and the "Error (°F)" column shows the deviation of that straight line compared to the actual temperature. Try different values of compensating resistance until you can obtain all the errors no larger than 1.0 °F. Record the value of the compensating resistor, and in the table, record the temperature corresponding to the largest error, the compensated resistance values at that temperature, at 30 ° F (Rp30) and at 100 °F (Rp100), and also the error at each temperature. Compensating resistance = Temperature Resistance Error T(largest error) = 30 °F Rp30 = 100 °F Rp100 = 4. Obtain a decade resistance box, where by means of the dial settings, you can dial in a wide variety of resistance by adding the setting of each dial together. Set the box resistance to the value you entered in the thermistor file for your compensating resistor. Check the resistance using the DMM, and adjust the setting as needed until it matches the compensating resistance. Measure the actual resistance between the terminals and record the resistance as calculated from the dial settings (they may be slightly different). Actual Resistance = ____________________ Resistance from dial settings = _________________ 5. Connect the thermistor across the decade resistance box and let the thermistor stabilize for about one minute before measuring the resistance across the combination (RpT) at room temperature. Repeat while holding the thermistor between your fingers for one minute. Resistance at Room Temp = _______________ Resistance at Finger Temp = __________________ 6. The relationship between Fahrenheit temperature and the parallel combination (Rp) of your thermistor and compensation resistor is given by equation (4): T = 100 - 70 (RpT - Rp100) Rp30 - Rp100 where RpT = measured Rp at unknown temperature T 4) Substituting the values you recorded from the spreadsheet, calculate room temperature and the temperature of your fingers and record them Room Temperature = _____________________ Finger Temperature = _______________________ 7. Assuming the temperature probe was most accurate, in a short paragraph, compare the results obtained using the thermistor when uncompensated in part 1 and then when compensated in part 6. Lab 10 - Electrical Transducers Page 3 of 6 8. What effect does linearizing a thermistor have on the sensitivity of the transducer (R / Temp)? The sensitivity is the slope in Figure 1 or in 2. Which is higher? Which is closer to being constant? Activity #2 – Photoresistor Light Sensor The photo resistor or photoconductive cell responds to light in much the same way that the thermistor responds to temperature. It too is made from a semiconductor material, and its resistance decreases with increasing light intensity. The characteristic curve is non-linear, but approximates a straight line when plotted on log-log scales as shown in the figure below. 100k Resistance 10k 1k 100 0.1 1.0 10 100 1000 Illumination in footcandles 1. Obtain a photoresistor and mount it on the protoboard. Position the photo resistor so that it faces upward toward the ceiling. Measure and record in the table below, the resistance with the photoresistor covered and uncovered by your hand. Mark the resistances on the graph above, and estimate and record the illumination level in foot-candles for the two resistances measured. Remember that both scales are log scales and are not linear between powers of 10. For instance, half way between 1 and 10 is 3 on a log scale. Resistance ohms Illumination level footcandles Photoresistor uncovered Photoresistor covered Lab 10 - Electrical Transducers Page 4 of 6 2. Assemble the following circuit on your protoboard. Pin numbers for the 741 op amp are shown in the diagram. The protoboard supply voltages (and ground) must be connected to the proper components. Place your IC so that it straddles one of the three furrows running from top to the bottom on the protoboard. Remember that the oscilloscope ground clip, the black terminal on the DMM, and the ground terminal on the protoboard should all be connected together and connected to the circuit ground shown. Note that the voltage across the photoresistor has both an AC and a DC component and that the AC portion is passed through the capacitor (ac-coupled) to the op amp input. The capacitor and 20 KΩ resistor form a high pass filter circuit like you saw in Lab #8. 1K 82K +5V +15V 15K 2 + To DMM 1UF 3 photo resistor 20K – 741 + 7 6 4 To Scope -15V 3. Measure the DC voltage across the photoresistor and the AC voltage at the output for two conditions as before: (1) sensor exposed to light, and (2) sensor shielded from light with your hand. Use the Digital Multimeter to measure the DC voltage across the photoresistor and use the oscilloscope to measure the output voltage. Be sure to turn off your computer monitor or point it away from your circuit so that its light does not interfere. Use the cursors on the scope to measure the period, the frequency and the peak-to-peak voltage of both waveforms. Place your data in the table below. VDC Period Frequency VPP Sensor exposed to light Sensor shielded from light 4. What is the source of the light producing the 120 Hz waveform? (Hint: Look at the scope when the room lights are turned off.) 5. Why is the frequency 120 Hz and not 60 Hz? (Hint: AC Power is 60 Hz). Lab 10 - Electrical Transducers Page 5 of 6 6. Knowing that the photoresistor has a high resistance at low light levels, analyze the voltage divider in the circuit diagram and explain why the DC voltage is higher at low light levels. 7. Knowing that the photoresistor also has a higher sensitivity (R / Light) at low light levels as shown by the slope in the figure below, explain why the AC peak to peak voltage is roughly the same size at both low and high light levels. Figure 3. Photoresistor Characteristic Curve Lab 10 - Electrical Transducers Page 6 of 6
