BSTA 6652 Take-home Final Exam Winter 2012
advertisement
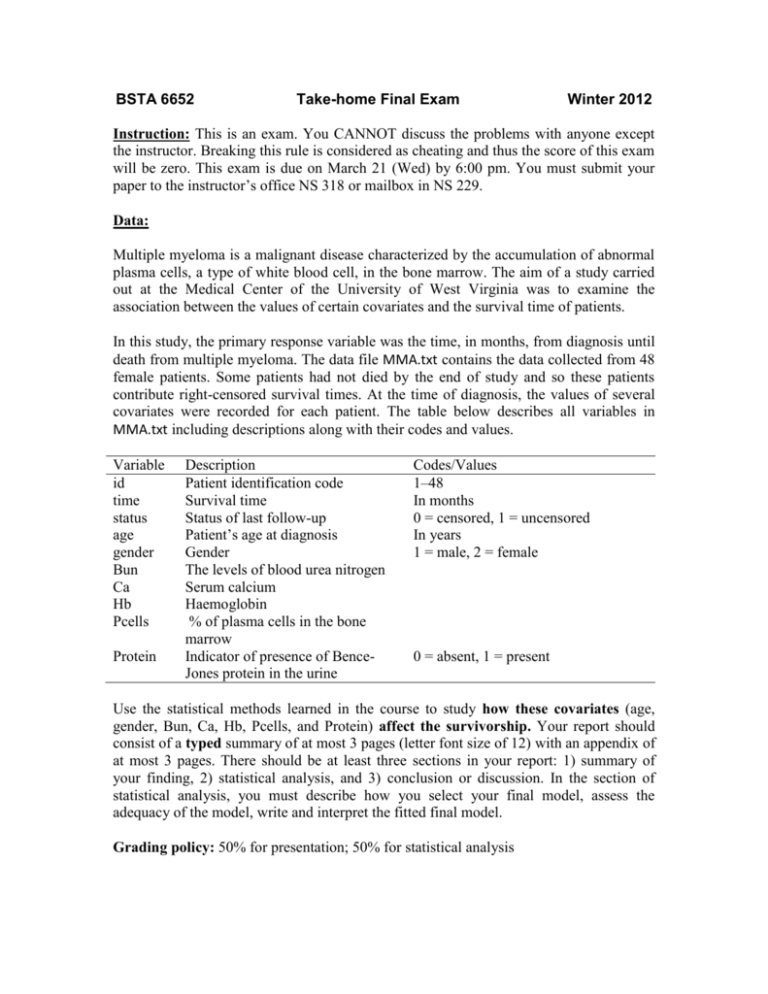
BSTA 6652 Take-home Final Exam Winter 2012 Instruction: This is an exam. You CANNOT discuss the problems with anyone except the instructor. Breaking this rule is considered as cheating and thus the score of this exam will be zero. This exam is due on March 21 (Wed) by 6:00 pm. You must submit your paper to the instructor’s office NS 318 or mailbox in NS 229. Data: Multiple myeloma is a malignant disease characterized by the accumulation of abnormal plasma cells, a type of white blood cell, in the bone marrow. The aim of a study carried out at the Medical Center of the University of West Virginia was to examine the association between the values of certain covariates and the survival time of patients. In this study, the primary response variable was the time, in months, from diagnosis until death from multiple myeloma. The data file MMA.txt contains the data collected from 48 female patients. Some patients had not died by the end of study and so these patients contribute right-censored survival times. At the time of diagnosis, the values of several covariates were recorded for each patient. The table below describes all variables in MMA.txt including descriptions along with their codes and values. Variable id time status age gender Bun Ca Hb Pcells Protein Description Patient identification code Survival time Status of last follow-up Patient’s age at diagnosis Gender The levels of blood urea nitrogen Serum calcium Haemoglobin % of plasma cells in the bone marrow Indicator of presence of BenceJones protein in the urine Codes/Values 1–48 In months 0 = censored, 1 = uncensored In years 1 = male, 2 = female 0 = absent, 1 = present Use the statistical methods learned in the course to study how these covariates (age, gender, Bun, Ca, Hb, Pcells, and Protein) affect the survivorship. Your report should consist of a typed summary of at most 3 pages (letter font size of 12) with an appendix of at most 3 pages. There should be at least three sections in your report: 1) summary of your finding, 2) statistical analysis, and 3) conclusion or discussion. In the section of statistical analysis, you must describe how you select your final model, assess the adequacy of the model, write and interpret the fitted final model. Grading policy: 50% for presentation; 50% for statistical analysis
