Liquids and Pennies Lab Document
advertisement
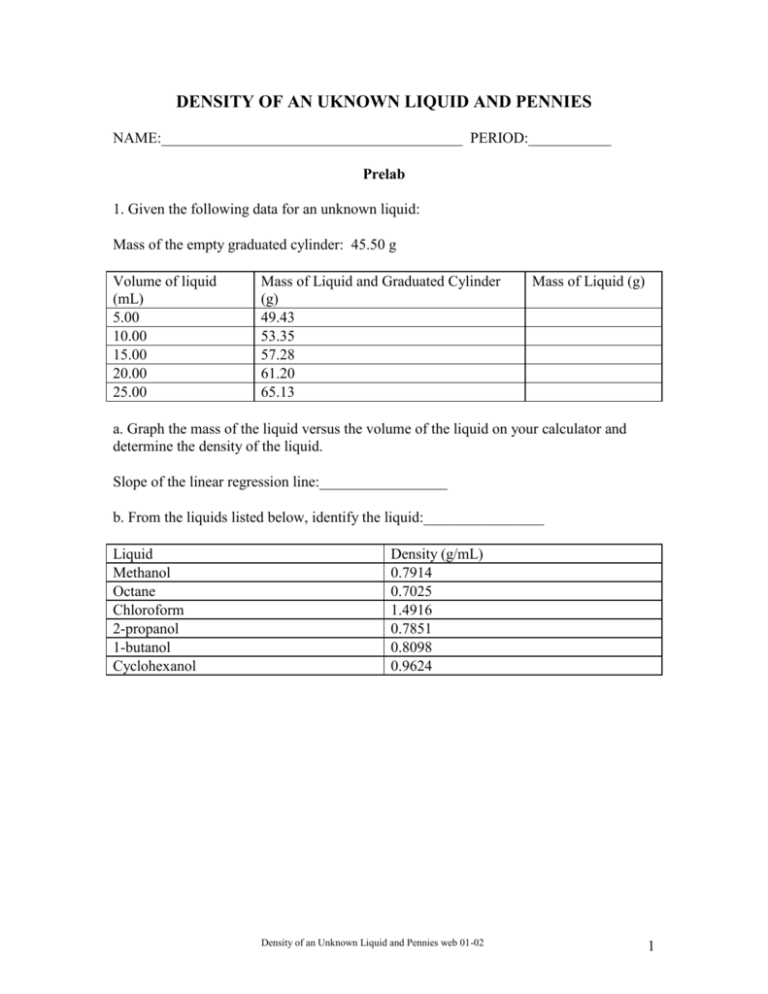
DENSITY OF AN UKNOWN LIQUID AND PENNIES NAME:________________________________________ PERIOD:___________ Prelab 1. Given the following data for an unknown liquid: Mass of the empty graduated cylinder: 45.50 g Volume of liquid (mL) 5.00 10.00 15.00 20.00 25.00 Mass of Liquid and Graduated Cylinder (g) 49.43 53.35 57.28 61.20 65.13 Mass of Liquid (g) a. Graph the mass of the liquid versus the volume of the liquid on your calculator and determine the density of the liquid. Slope of the linear regression line:_________________ b. From the liquids listed below, identify the liquid:________________ Liquid Methanol Octane Chloroform 2-propanol 1-butanol Cyclohexanol Density (g/mL) 0.7914 0.7025 1.4916 0.7851 0.8098 0.9624 Density of an Unknown Liquid and Pennies web 01-02 1 DENSITY OF AN UKNOWN LIQUID AND PENNIES All matter takes up space (volume) and has mass. Mass, the amount of matter in a substance, is determined by comparing the mass of the object to a standard mass. A balance compares the force exerted on the object (force = the mass of the object times the acceleration due to gravity) to the force exerted on a standard mass. If we assume the acceleration due to gravity on the objects is constant, the balance can measure the mass of the object. The unit for mass is a gram, g. This is defined as the mass of 1 cm3 of water at 4C. A special relationship exists between the volume occupied by a sample of matter and the mass of the sample. This relationship is referred to as the density. Density is defined as mass per unit volume or the ratio of mass to volume. Mathematically this can be written as Density mass(g) volume(mL) or Density m g V mL Determining the density of a sample of matter is one of the least complex of all laboratory procedures. The mass and the volume of several samples of a particular substance is measured and the resulting data is substituted into the mathematical expression above. The density can also be determined from a graph of the mass and the volume. If you graph mass on the y-axis versus volume on the x-axis, the slope of the line is the ratio of the mass to the volume, which is the density. y y Mass x x Volume The symbol, (delta), means a change in a given value. Density y mass(g) m x volume(mL) V In this experiment, we will determine the density of an unknown liquid (1) mathematically and (2) graphically and use the density to identify the liquid. We will determine the densities of pennies minted before 1982 and those after 1983 and use these densities to determine the primary metal in each set of pennies. The data will be graphed using the TI-83 graphing calculator. Density of an Unknown Liquid and Pennies web 01-02 2 Procedure: Part I: Density of the Unknown Liquid: A. Determining Density Mathematically 1. Measure the mass of a clean, dry, graduated cylinder. Record the mass to the correct number of significant figures in Data Table 1. 2. Add about 10mL of the unknown liquid to the graduated cylinder. Record the volume of the liquid to the correct number of significant figures in the Data Table. Note: When determining the volume of a liquid in a graduated cylinder, read the level of the liquid from the bottom of the meniscus, which should be at eye level. 3. Measure the mass of the graduated cylinder and liquid. Record the mass to the correct number of significant figures in the Data Table. 4. Add an additional 10mL of liquid to the graduated cylinder. Record the volume of the liquid in the Data Table. 5. Measure the mass of the graduated cylinder and liquid. Record the total mass of liquid in the graduated cylinder in the Data Table. 6. Repeat steps 4 & 5 three more times. Record all volumes and masses to the correct number of significant figures. 7. Pour the unknown liquid in the container provided by your instructor and dry the graduated cylinder. 8. Calculate the density for each sample of the unknown liquid and record the value to the correct number of significant figures in the Data Table. 9. Calculate the average density of the unknown liquid. Part B. Determining Density Graphically Creating Data Lists 1. Turn on the TI-83+ calculator and press [STAT]. Press [ENTER]. 2. Using the arrow keys, highlight L1. Press [CLEAR] and [ENTER]. 3. Using the arrow keys, highlight L2. Press [CLEAR] and [ENTER]. 4. Enter the collected volumes of the liquid from the Data Table into L1. 5. Enter the collected masses of the liquid from the Data Table into L2. Density of an Unknown Liquid and Pennies web 01-02 3 6. Check our data entries. If corrections need to be made to data entered in a list, use the arrow keys to position the cursor over the entry that you wish to change. Type in the new entry and press [ENTER]. Graphing Data Lists 1. Press [STATPLOT]. (This command displays the STAT PLOTS screen. All Plots are probably turned “Off”. If any other plots besides Plot 1 are “ON”, they should be turned “Off” before graphing the data. ) 2. Press [1] or use the cursor to highlight 1. Press [ENTER]. (This displays the Plot1 screen) 3.The 5 options you may select are: a) On vs. Off: To turn the plot On, position cursor over (On) and press [ENTER]. b) Type: Select the first graph (scatter plot) by positioning the cursor there and pressing [ENTER]. c) X list: This determines which list will be plotted on the X (horizontal axis); use the second function keys to enter L1 and press [ENTER]. d) Y list: This determines which list will be plotted on the Y (vertical axis); use the second function keys to enter L2, and press [ENTER]. e) Mark: This determines shape/size of data points plotted. Move the cursor over the small square and press [ENTER]. 4. After selecting the desired options (remember to turn the plot ON!), press [GRAPH]. 5. Your graph may not display all of your data points (because the graphing window is not set properly); press [ZOOM]. Select Zoomstat. Press [ENTER] to automatically select a window that displays the full range of your data. Determining the slope and intercept of a linear relationship Now that we have a linear relationship between our two data sets (L2 on the vertical axis; L1 on the horizontal axis), how can we find the slope and the y-intercept of the line that best fits this linear relationship? 1. Press [STAT] (in order to access the STAT menu) 2. Arrow right to (CALC) (the sub-menu displays a number of relationships that could fit the data) 3. Select LinReg(ax+b). Press [ENTER]. Press [L1] [,] [L2]. Press [ENTER]. Density of an Unknown Liquid and Pennies web 01-02 4 The results of the least-squares fit (linear regression) appear on the (LinReg) screen: a = slope of the line b = y-intercept of the line r = correlation coefficient (a measure of how well the this line fits the data) The closer the absolute value of r is to 1.00, the better the data fit a straight line. If the correlation coefficient does not appear on the screen, press [CATALOG]. Use the arrow keys to select [Diagnostics On] and press [ENTER] twice. The screen should show Diagnostic On and Done. Run the linear regression analysis again. Record these values in the Data Table. Plotting the best-fit line AND the data on the same screen: 1. Press [Y=] 2. Press [CLEAR] to delete any unwanted function. 3. Press [VARS] 4. Select Statistics. Press [ENTER]. 5. Arrow right to EQ since we want an equation. 6. Select RegEQ and press [ENTER]. The regression equation appears in the Y1 slot. 7.Press [GRAPH] and both the data and the line will be plotted. Sketch the graph on your report sheet. Part II: Density of Pennies I. Collecting Mass and Volume Data: Work with one set of pennies at a time, either pre-1982 pennies or post-1983 pennies. 1. Determine the mass of 5 pennies from one set using centigram balance. Record this mass in the appropriate data table. 2. Add 5 more pennies to the first group and determine the mass of these 10 pennies. Record this mass. 3. Repeat step2, each time adding 5 more pennies to those already on the balance, until all 25 pennies have been used. Keep track of the order of the groups of pennies as you mass them. 4. Fill a 50-mL graduated cylinder to about the 20.0-mL mark with water. Be sure to read the bottom of the meniscus to measure the water level. Record the initial volume. 5. Still working with the same set of pennies, gently drop the first group of 5 pennies into the graduated cylinder. Record the total water level in the appropriate data table. Density of an Unknown Liquid and Pennies web 01-02 5 6. Add the next group of 5 pennies to the graduated cylinder, making a total of 10 pennies. Record the new total water level. 7. Repeat step 6 until all 25 pennies have been added to the graduated cylinder. 8. Discard the water in the graduated cylinder. Dry the pennies with a paper towel and put the dry pennies back into their container. Do not mix the pre-1982 pennies with the post1983 pennies. 9. Repeat steps 1-8 using the other set of 25 pennies. 10. Complete the data tables by calculating the net volume of pennies by subtracting the initial volume from the total volume. II. Determining Density Graphically Using the Calculator: A. Creating Data Lists 1. Turn on the TI-83 calculator and press [STAT]. EDIT is highlighted. Press [ENTER]. 2. To clear any previous data in the list, using the arrow keys, highlight the column heading L1. Press [CLEAR] and [ENTER]. 3. Repeat this process to clear L2, L3, and L4. 4. Enter the volumes of the pre-1982 pennies into L1. 5. Enter the masses of the pre-1982 pennies into L2. 6. Enter the volumes of the post-1983 pennies into L3. 7. Enter the masses of the post-1983 pennies into L4. 8. Check our data entries. If corrections need to be made to data entered into either list, use the arrow keys to position the cursor over the entry that you wish to modify; type in the new entry and press [ENTER]. B: Graphing Data Lists - Pre-1982 Pennies 1.Press [Y=]. If there are any formulas present, move the cursor onto the equals sign and press [CLEAR] to remove any existing formulas. 2. Press [STATPLOT], then select Plot1. Press [ENTER]. Use the arrow keys to position the cursor on each of the following Plot1 settings. Press [ENTER] to select any of the settings Density of an Unknown Liquid and Pennies web 01-02 6 you change: Plot1 = On, Type = Scatter (1st type). On the TI-83, enter X list = L1 Y list = L2 from the yellow 2nd function keys. Select Mark = square. 3. Press [GRAPH], then [ZOOM]. Select ZoomStat and press [ENTER]. Determining the slope and intercept of a linear relationship Now that we have a linear relationship between our two data sets (L2 on the vertical axis; L1 on the horizontal axis), how can we find the slope and the y-intercept of the line that best fits this linear relationship? 1. To calculate the best-fit regression line for your graph: a. Press [STAT]. Arrow right to display the CALC menu. Select LinReg(ax+b). Press [ENTER]. b. To identify the lists that correspond to the two variables, press [L1] [,] [L2]. Press [ENTER]. The statistics are displayed for the equation in the form: y = ax + b x is the volume, y is the mass, a is a the slope of the line, b is the y-intercept, and r is the correlation factor. The closer the value of r is to positive or negative one the better the data fits a straight line. Record these values in the Data Table. (On the TI-83, if the r value does not appear on the screen, press [CATALOG]. Arrow down to Diagnostic On and press [ENTER] twice. The screen should show Diagnostic On and Done. Run the linear regression analysis again. Record your results in the corresponding Data Table. 2. To display a best-fit regression line on the graph of, press [Y=] and clear any equations that may be there. Press [VARS]. Select STATISTICS and press [ENTER]. Press the right arrow key to display the EQ menu. Select RegEQ and press [ENTER] to copy the linear regression equation to Y1=. 3. Press [GRAPH] to view the graph with a best-fit regression line. C: Graphing Data Lists - Post-1983 Pennies 1. Repeat the graphing procedure above for the post-1983 pennies changing L1 to L3 and L2 to L4. 2. Record your results in the corresponding Data Table. Density of an Unknown Liquid and Pennies web 01-02 7 DENSITY OF AN UKNOWN LIQUID AND PENNIES NAME____________________________________________PERIOD__________ LAB PARTNER_____________________________________COURSE_________ Data Table Part I: Density of Unknown Liquid Mass of dry, empty graduated cylinder:__________________ g. Volume of Liquid (mL) Mass of graduated Mass of Liquid (g) Density of Liquid (g/mL) cylinder + Liquid (g) Average Density Substance Slope of Line Intercept Correlation Coefficient Unknown Liquid Sketch the graphs of mass-volume data for water and the unknown liquid below. Label the axes. Calculations: 1. Calculate the density of the unknown liquid for each pair of mass-volume data in the Data Table by substituting the collected data into the mathematical definition of density. Record the calculated densities in the Data Table. Show your calculations for one of the pairs below. Density of an Unknown Liquid and Pennies web 01-02 8 Conclusion Questions 1. How closely did your “best fit” line for the unknown liquid match your graphed data points? ________________________________________________________________________ ________________________________________________________________________ 2. What does the slope of the line represent? __________________________________________________________________ __________________________________________________________________ 3. Were the calculated densities for the unknown liquid the same for all four trials? Explain. ________________________________________________________________________ ________________________________________________________________________ 4. From the list of densities given below, identify the unknown liquid used in this activity. ____________________________ Liquid 91% isopropanol 70/30 isopropanol/water 65/35 isopropanol/water 60/40 isopropanol/water 50/50 isopropanol/water 40/60 isopropanol/water 30/70 isopropanol/water 20/80 isopropanol/water water isopropanol/water Density (g/mL) 0.8121 0.8688 0.8779 0.8873 0.9061 0.9248 0.9436 0.9624 1.0000 5. How closely did your average density and the slope of the regression line for the unknown liquid agree with one of the table values? ________________________________________________________________________ ________________________________________________________________________ 6. How could you improve the determination of the density? ________________________________________________________________________ ________________________________________________________________________ Density of an Unknown Liquid and Pennies web 01-02 9 Part II. Pre-1982 Pennies Initial volume of water in the graduated cylinder:________________mL Number of Pennies Mass of Pennies (g) Total Volume in the Cylinder (mL) Net Volume of the Pennies (mL) Slope of the line y-intercept Correlation factor 5 10 15 20 25 Calculator II. Post-1983 Pennies Initial volume of water in the graduated cylinder:________________mL Number of Pennies Mass of Pennies (g) Total Volume in the Cylinder (mL) Net Volume of the Pennies (mL) Slope of the line y-intercept Correlation factor 5 10 15 20 25 Calculator Followup Questions: 1.Using the density data given below: What is the major metal present in the pre-1982 pennies: ____________ What is the major metal present in the post-1983 pennies: ____________ Metal Aluminum Copper Iron Lead Silver Zinc Density (g/mL) 2.70 8.92 7.86 11.34 10.5 7.14 Density of an Unknown Liquid and Pennies web 01-02 10 2. Suggest a reason for the change in composition of the pennies. 3. How well did your data fit a linear relationship? What factors might cause error in individual data points? Density of an Unknown Liquid and Pennies web 01-02 11
