Economic Benefits Summary
advertisement
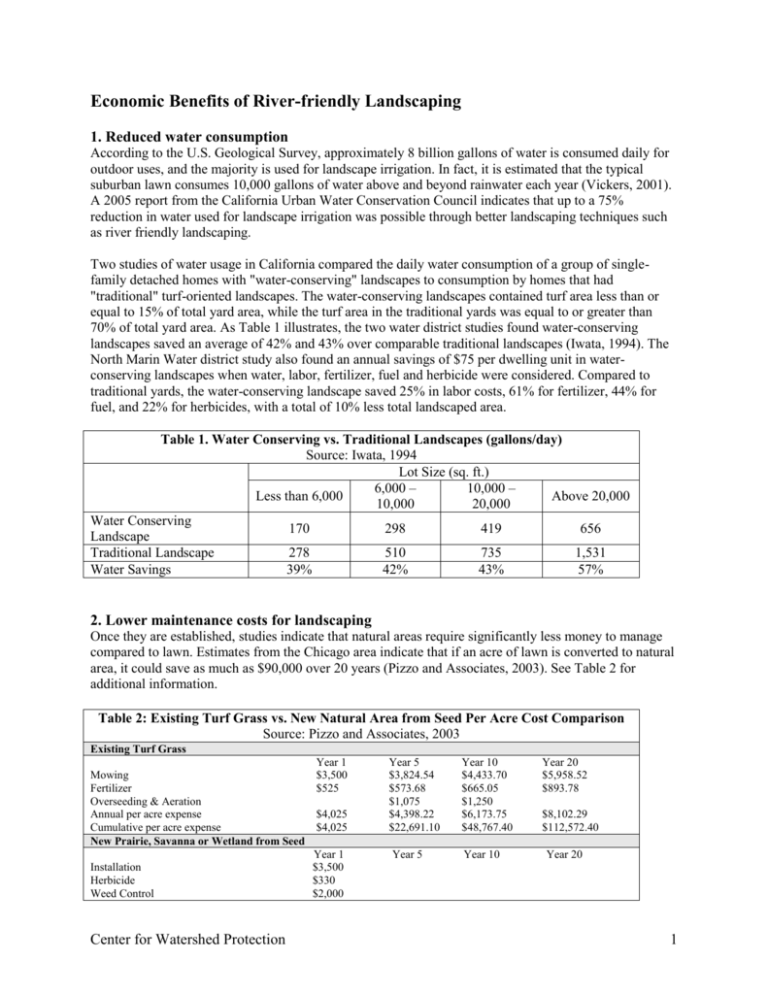
Economic Benefits of River-friendly Landscaping 1. Reduced water consumption According to the U.S. Geological Survey, approximately 8 billion gallons of water is consumed daily for outdoor uses, and the majority is used for landscape irrigation. In fact, it is estimated that the typical suburban lawn consumes 10,000 gallons of water above and beyond rainwater each year (Vickers, 2001). A 2005 report from the California Urban Water Conservation Council indicates that up to a 75% reduction in water used for landscape irrigation was possible through better landscaping techniques such as river friendly landscaping. Two studies of water usage in California compared the daily water consumption of a group of singlefamily detached homes with "water-conserving" landscapes to consumption by homes that had "traditional" turf-oriented landscapes. The water-conserving landscapes contained turf area less than or equal to 15% of total yard area, while the turf area in the traditional yards was equal to or greater than 70% of total yard area. As Table 1 illustrates, the two water district studies found water-conserving landscapes saved an average of 42% and 43% over comparable traditional landscapes (Iwata, 1994). The North Marin Water district study also found an annual savings of $75 per dwelling unit in waterconserving landscapes when water, labor, fertilizer, fuel and herbicide were considered. Compared to traditional yards, the water-conserving landscape saved 25% in labor costs, 61% for fertilizer, 44% for fuel, and 22% for herbicides, with a total of 10% less total landscaped area. Table 1. Water Conserving vs. Traditional Landscapes (gallons/day) Source: Iwata, 1994 Lot Size (sq. ft.) 6,000 – 10,000 – Less than 6,000 Above 20,000 10,000 20,000 Water Conserving 170 298 419 656 Landscape Traditional Landscape 278 510 735 1,531 Water Savings 39% 42% 43% 57% 2. Lower maintenance costs for landscaping Once they are established, studies indicate that natural areas require significantly less money to manage compared to lawn. Estimates from the Chicago area indicate that if an acre of lawn is converted to natural area, it could save as much as $90,000 over 20 years (Pizzo and Associates, 2003). See Table 2 for additional information. Table 2: Existing Turf Grass vs. New Natural Area from Seed Per Acre Cost Comparison Source: Pizzo and Associates, 2003 Existing Turf Grass Mowing Fertilizer Overseeding & Aeration Annual per acre expense Cumulative per acre expense New Prairie, Savanna or Wetland from Seed Installation Herbicide Weed Control Center for Watershed Protection Year 1 $3,500 $525 $4,025 $4,025 Year 1 $3,500 $330 $2,000 Year 5 $3,824.54 $573.68 $1,075 $4,398.22 $22,691.10 Year 10 $4,433.70 $665.05 $1,250 $6,173.75 $48,767.40 Year 5 Year 10 Year 20 $5,958.52 $893.78 $8,102.29 $112,572.40 Year 20 1 Table 2: Existing Turf Grass vs. New Natural Area from Seed Per Acre Cost Comparison Source: Pizzo and Associates, 2003 Burn Management $546.36 $633.39 $851.22 Annual per acre expense $5,830 $546.36 $633.39 $851.22 Cumulative per acre expense $5,830 $13,187.31 $16,175.05 $23,653.93 Per Acre Savings -$1,805 $9,503.79 $32,592.35 $88,918.46 Percentage Savings -44.8% 41.9% 66.8% 79% Assumptions: Project area is greater than one acre. Rate of inflation is 3 percent. Labor rate is non-prevailing wage. Lawn is maintained by a professional landscape maintenance company. Estimates from the US EPA indicate that Americans spend about $25 billion/year on lawn care. The average 1 acre lawn costs $400-700/year to maintain and requires Americans dedicate 40 hours/year to mowing. Americans also spend over $1 billion and apply about 67 million pounds of pesticides to suburban lawns each year. The use of river-friendly landscaping will allow homeowners to realize significant savings through reduced expenditure for gas, fertilizers, water for irrigation, and pesticides, as well as freeing up more time for other activities. The reduction in maintenance also creates environmental benefits. For instance, the U.S. Environmental Protection Agency has calculated that that a gasoline-powered lawn mower pollutes as much in one hour as does driving an automobile for 20 miles (NIPC, 2004). Gas-powered mowers also use approximately 580 million gallons of gas/year. 3. Increased Benefits to Homeowners Studies in America and Britain show that good tree cover increases property value by 6-15% (Peck et al., 1999). A USDA Forest Service, Center for Urban Forest Research (Center) study found that residents of Glendale, California are receiving $2.41 in environmental benefits for every $1 the city invests in the care and maintenance of its municipal trees. The Sacramento, CA Tree Foundation states that houses in tree lined neighborhoods sell for a premium and that each large front yard tree adds 1% to sales price and large specimen trees can add 10%, or more, to property values. http://www.sactree.com/treeInfo/benefitsOfTrees/benefitsPropertyValues.html A 2005 study conducted in southeast Michigan indicates that when people were asked to rank their choices of four different yard designs (three of which included native plants) in three different settings, with different monthly maintenance costs, the participants were willing to pay more for well-designed yards including native plants than for lawns, and that their increased willingness to pay exceeds any increase in costs associated with the native plantings. The Center for Neighborhood Technology’s Green Values Stormwater Calculator (http://greenvalues.cnt.org/calculator) has the ability to estimate savings from conventional versus green development for several scenarios. According to the Calculator, a 0.25ac urban, single family home that replaces half the lawn by garden with native landscaping decreases the total 20 year life cycle costs by $2,591. The strategy also reduces peak discharge by 14%. Case Study The City of Santa Monica, CA is conducting a Garden\Garden Project comparing the benefits of a "California-friendly" garden approach using native plants, a dry creek bed and efficient irrigation, to an adjacent "traditional" garden. Costs, labor hours, plant growth, water consumption, greenwaste production and other environmental factors are being tracked and compared for both gardens. Current project Center for Watershed Protection 2 assessments indicate that the native garden is using 7 times less water and costs 50% less to maintain than the traditional garden http://santa-monica.org/epd/news/GardenGarden.htm http://santa-monica.org/epd/residents/Water/pdf/GG_Project_Description2006.pdf References California Urban Water Conservation Council. 2005. Water Smart Landscapes for California: AB 2717 Landscaping Task Force Findings. Report to the Governor and Legislature. Center for Neighborhood Technology. 2007. Green Values Stormwater Calculator. http://greenvalues.cnt.org/calculator Helfand, G., J. Park, J. Nassauer, S. Kosek. 2005. The economics of native plants in residential landscape designs. Landscape and Urban Planning, Volume 78, Issue 3, 9 November 2006, Pages 229-240 Iwata, L. Xeriscape: Winning the Turf War over Water. Home Energy Magazine Online July/August 1994. http://www.homeenergy.org/archive/hem.dis.anl.gov/eehem/94/940711.html Northeastern Illinois Planning Commission (NIPC). 2004. Sourcebook on Natural Landscaping For Local Officials. http://www.nipc.org/environment/sustainable/content.htm Peck & Associates. (1999). Green Roofs for Healthy Cities. Toronto: Peck & Associates. Pizzo and Associates. Recreation Management. Going Native. April 2003. http://www.recmanagement.com/columns.php?fid=200304GC02 USDA Natural Resources Conservation Service. Creating Native Landscapes in the Northern Great Plains and Rocky Mountains. http://www.mt.nrcs.usda.gov/technical/ecs/plants/xeriscp/index.html US EPA Great Lakes Program. Sustainable Landscaping: The Hidden Impacts of Gardens. Danielle Green of the Great Lakes National Program Office and Dan Welker of EPA Region 3. http://www.epa.gov/greenacres/smithsonian.pdf Vickers, A. 2001. Handbook of Water Use and Conservation. WaterPlow Press. Amherst, MA. Center for Watershed Protection 3
