Table 3 Grain size characteristics and statistics for sand layers
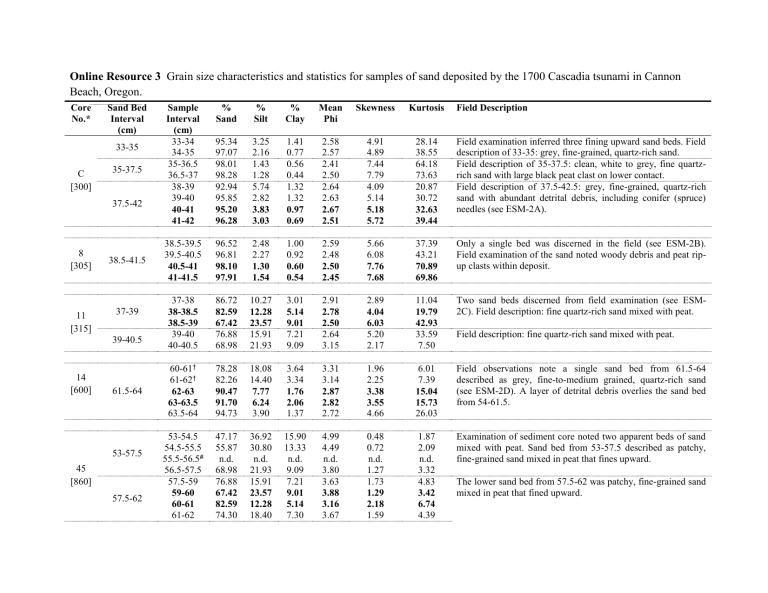
Online Resource 3 Grain size characteristics and statistics for samples of sand deposited by the 1700 Cascadia tsunami in Cannon
Beach, Oregon.
Core
No.*
C
[300]
8
[305]
11
[315]
14
[600]
45
[860]
Sand Bed
Interval
(cm)
33-35
35-37.5
37.5-42
38.5-41.5
37-39
39-40.5
61.5-64
53-57.5
57.5-62
Sample
Interval
(cm)
%
Sand
%
Silt
%
Clay
Mean
Phi
33-34
34-35
95.34 3.25 1.41 2.58
97.07 2.16 0.77 2.57
35-36.5 98.01 1.43 0.56 2.41
36.5-37 98.28 1.28 0.44 2.50
38-39
39-40
40-41
41-42
92.94 5.74 1.32 2.64
95.85 2.82 1.32 2.63
95.20 3.83 0.97 2.67
96.28 3.03 0.69 2.51
38.5-39.5 96.52 2.48 1.00 2.59
39.5-40.5 96.81 2.27 0.92 2.48
40.5-41 98.10 1.30 0.60 2.50
41-41.5 97.91 1.54 0.54 2.45
37-38 86.72 10.27 3.01 2.91
38-38.5 82.59 12.28 5.14 2.78
38.5-39 67.42 23.57 9.01 2.50
39-40 76.88 15.91 7.21 2.64
40-40.5 68.98 21.93 9.09 3.15
60-61
†
78.28 18.08 3.64 3.31
61-62
†
82.26 14.40 3.34 3.14
62-63 90.47 7.77 1.76 2.87
63-63.5 91.70 6.24 2.06 2.82
63.5-64 94.73 3.90 1.37 2.72
53-54.5 47.17 36.92 15.90 4.99
54.5-55.5 55.87 30.80 13.33 4.49
55.5-56.5
# n.d. n.d. n.d. n.d.
56.5-57.5 68.98 21.93 9.09 3.80
57.5-59 76.88 15.91 7.21 3.63
59-60
60-61
61-62
67.42 23.57 9.01 3.88
82.59 12.28 5.14 3.16
74.30 18.40 7.30 3.67
Skewness Kurtosis Field Description
5.66
6.08
7.76
7.68
2.89
4.04
6.03
5.20
4.91
4.89
7.44
7.79
4.09
5.14
5.18
5.72
2.17
1.96
2.25
3.38
3.55
4.66
0.48
0.72 n.d.
1.27
1.73
1.29
2.18
1.59
28.14 Field examination inferred three fining upward sand beds. Field
38.55 description of 33-35: grey, fine-grained, quartz-rich sand.
64.18 Field description of 35-37.5: clean, white to grey, fine quartz-
73.63 rich sand with large black peat clast on lower contact.
20.87 Field description of 37.5-42.5: grey, fine-grained, quartz-rich
30.72 sand with abundant detrital debris, including conifer (spruce)
32.63
39.44 needles (see ESM-2A).
37.39 Only a single bed was discerned in the field (see ESM-2B).
43.21 Field examination of the sand noted woody debris and peat rip-
70.89
69.86 up clasts within deposit.
11.04 Two sand beds discerned from field examination (see ESM-
19.79 2C). Field description: fine quartz-rich sand mixed with peat.
42.93
33.59 Field description: fine quartz-rich sand mixed with peat.
7.50
6.01
7.39
15.04
Field observations note a single sand bed from 61.5-64 described as grey, fine-to-medium grained, quartz-rich sand
(see ESM-2D). A layer of detrital debris overlies the sand bed from 54-61.5. 15.73
26.03
1.87
2.09 n.d.
3.32
4.83
Examination of sediment core noted two apparent beds of sand mixed with peat. Sand bed from 53-57.5 described as patchy, fine-grained sand mixed in peat that fines upward.
The lower sand bed from 57.5-62 was patchy, fine-grained sand mixed in peat that fined upward. 3.42
6.74
4.39
Online Resource 3 (Continued.)
Core
No.
X
Sand Bed
Interval
(cm)
Sample
Interval
(cm)
50-51
%
Sand
%
Silt
%
Clay
Mean
Phi
73.23 19.18 7.59 3.65
Skewness
1.55
Kurtosis
4.12
50-52
[1225]
51-52 74.30 18.12 7.58 3.53 1.59 4.20
Note: Figures in bold show data for samples used as inputs for sediment transport modeling.
Field Description
A single sand bed was observed in the field and described as muddy, fine-grained sand.
*Values in brackets represent distance in meters from core site to the beach.
†
Sample includes detrital organic material from overlying debris layer.
# Sample interval 55.5-56.5 was spilled in lab and lost during sample preparation.
ESM-3

