Thermal Processing and Native Oxidation of Silicon Nanoparticles
advertisement
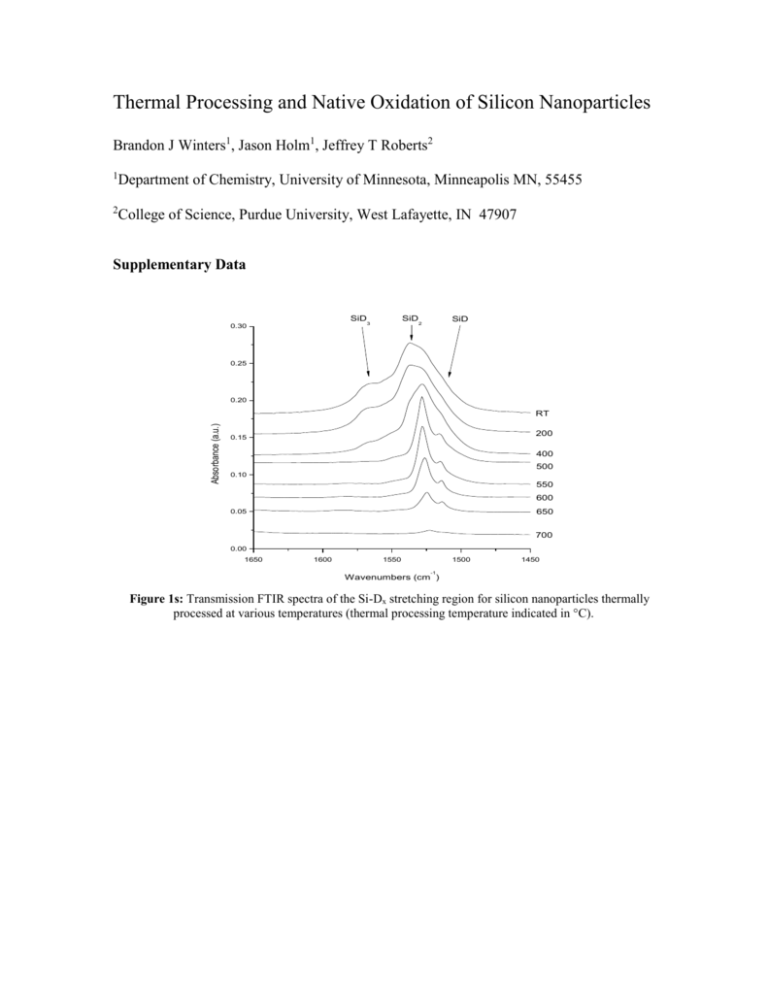
Thermal Processing and Native Oxidation of Silicon Nanoparticles Brandon J Winters1, Jason Holm1, Jeffrey T Roberts2 1 Department of Chemistry, University of Minnesota, Minneapolis MN, 55455 2 College of Science, Purdue University, West Lafayette, IN 47907 Supplementary Data SiD 0.30 SiD 3 SiD 2 0.25 0.20 Absorbance (a.u.) RT 200 0.15 400 500 0.10 550 600 650 0.05 700 0.00 1650 1600 1550 1500 1450 -1 Wavenumbers (cm ) Figure 1s: Transmission FTIR spectra of the Si-Dx stretching region for silicon nanoparticles thermally processed at various temperatures (thermal processing temperature indicated in °C). 1.0 1.0 (b) 400 0.8 0.8 0.6 0.6 1 month 0.4 1 week Absorbance (a.u.) Absorbance (a.u.) (a) 22 0.4 1 week 0.2 1 day 0.2 1 month 1 day 0 minutes 0 minutes 0.0 0.0 1600 1400 1200 1000 1600 800 1400 1.0 1000 800 Wavenumbers (cm ) 1.0 (d) 700 (c) 500 0.8 0.8 1 month 1 week 0.4 0.6 Absorbance (a.u.) 0.6 Absorbance (a.u.) 1200 -1 -1 Wavenumbers (cm ) 1 month 1 week 0.4 1 day 0.2 1 day 0.2 0 minutes 0 minutes 0.0 0.0 1600 1400 1200 1000 -1 Wavenumbers (cm ) 800 1600 1400 1200 1000 800 -1 Wavenumbers (cm ) Figure 2s: DRIFTS spectra of thermally treated deuterium terminated silicon nanoparticles at 4 time intervals of ambient oxidation (a) 22 °C, (b) 400 °C, (c) 500 °C, (d) 700 °C processing. 100 90 80 Fractional Oxide Content (Si 2p) 70 60 Increasing time of ambient 50 oxidation 40 30 20 10 0 0 100 200 300 400 500 600 700 800 Temperature (C) Figure 3s: XPS data for fractional oxide content of the Si 2p peak for four thermal processing temperatures after 0 days (squares), 1 week (circles), and 1month (triangles) ambient exposure.

