USING LANDSAT 5 TM DATA FOR COASTAL CHANGE DETECTION
advertisement
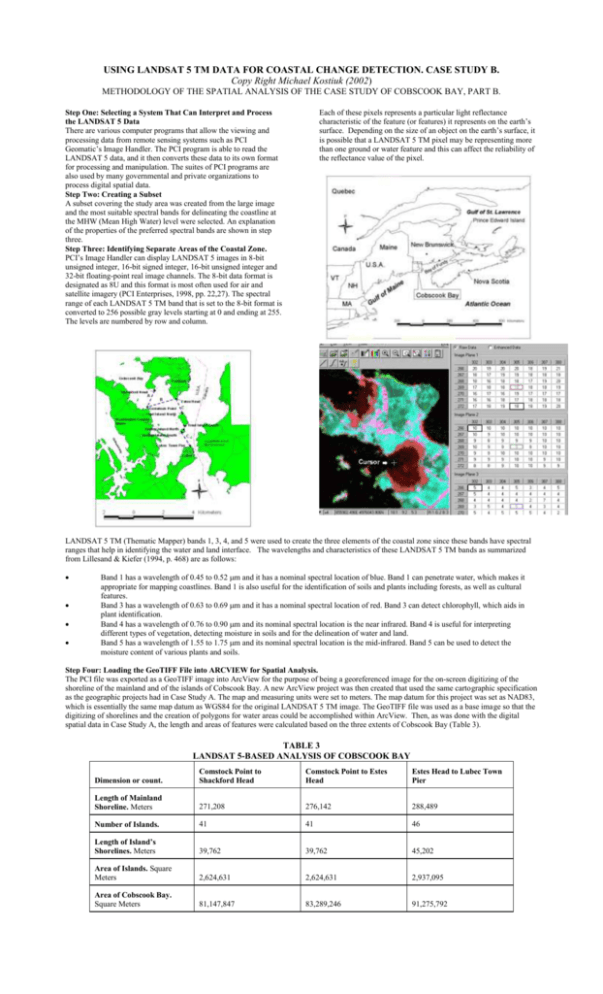
USING LANDSAT 5 TM DATA FOR COASTAL CHANGE DETECTION. CASE STUDY B. Copy Right Michael Kostiuk (2002) METHODOLOGY OF THE SPATIAL ANALYSIS OF THE CASE STUDY OF COBSCOOK BAY, PART B. Each of these pixels represents a particular light reflectance characteristic of the feature (or features) it represents on the earth’s surface. Depending on the size of an object on the earth’s surface, it is possible that a LANDSAT 5 TM pixel may be representing more than one ground or water feature and this can affect the reliability of the reflectance value of the pixel. Step One: Selecting a System That Can Interpret and Process the LANDSAT 5 Data There are various computer programs that allow the viewing and processing data from remote sensing systems such as PCI Geomatic’s Image Handler. The PCI program is able to read the LANDSAT 5 data, and it then converts these data to its own format for processing and manipulation. The suites of PCI programs are also used by many governmental and private organizations to process digital spatial data. Step Two: Creating a Subset A subset covering the study area was created from the large image and the most suitable spectral bands for delineating the coastline at the MHW (Mean High Water) level were selected. An explanation of the properties of the preferred spectral bands are shown in step three. Step Three: Identifying Separate Areas of the Coastal Zone. PCI’s Image Handler can display LANDSAT 5 images in 8-bit unsigned integer, 16-bit signed integer, 16-bit unsigned integer and 32-bit floating-point real image channels. The 8-bit data format is designated as 8U and this format is most often used for air and satellite imagery (PCI Enterprises, 1998, pp. 22,27). The spectral range of each LANDSAT 5 TM band that is set to the 8-bit format is converted to 256 possible gray levels starting at 0 and ending at 255. The levels are numbered by row and column. LANDSAT 5 TM (Thematic Mapper) bands 1, 3, 4, and 5 were used to create the three elements of the coastal zone since these bands have spectral ranges that help in identifying the water and land interface. The wavelengths and characteristics of these LANDSAT 5 TM bands as summarized from Lillesand & Kiefer (1994, p. 468) are as follows: Band 1 has a wavelength of 0.45 to 0.52 m and it has a nominal spectral location of blue. Band 1 can penetrate water, which makes it appropriate for mapping coastlines. Band 1 is also useful for the identification of soils and plants including forests, as well as cultural features. Band 3 has a wavelength of 0.63 to 0.69 m and it has a nominal spectral location of red. Band 3 can detect chlorophyll, which aids in plant identification. Band 4 has a wavelength of 0.76 to 0.90 m and its nominal spectral location is the near infrared. Band 4 is useful for interpreting different types of vegetation, detecting moisture in soils and for the delineation of water and land. Band 5 has a wavelength of 1.55 to 1.75 m and its nominal spectral location is the mid-infrared. Band 5 can be used to detect the moisture content of various plants and soils. Step Four: Loading the GeoTIFF File into ARCVIEW for Spatial Analysis. The PCI file was exported as a GeoTIFF image into ArcView for the purpose of being a georeferenced image for the on-screen digitizing of the shoreline of the mainland and of the islands of Cobscook Bay. A new ArcView project was then created that used the same cartographic specification as the geographic projects had in Case Study A. The map and measuring units were set to meters. The map datum for this project was set as NAD83, which is essentially the same map datum as WGS84 for the original LANDSAT 5 TM image. The GeoTIFF file was used as a base image so that the digitizing of shorelines and the creation of polygons for water areas could be accomplished within ArcView. Then, as was done with the digital spatial data in Case Study A, the length and areas of features were calculated based on the three extents of Cobscook Bay (Table 3). TABLE 3 LANDSAT 5-BASED ANALYSIS OF COBSCOOK BAY Dimension or count. Comstock Point to Shackford Head Comstock Point to Estes Head Estes Head to Lubec Town Pier Length of Mainland Shoreline. Meters 271,208 276,142 288,489 Number of Islands. 41 41 46 Length of Island’s Shorelines. Meters 39,762 39,762 45,202 Area of Islands. Square Meters 2,624,631 2,624,631 2,937,095 Area of Cobscook Bay. Square Meters 81,147,847 83,289,246 91,275,792


