Appendix 1
advertisement
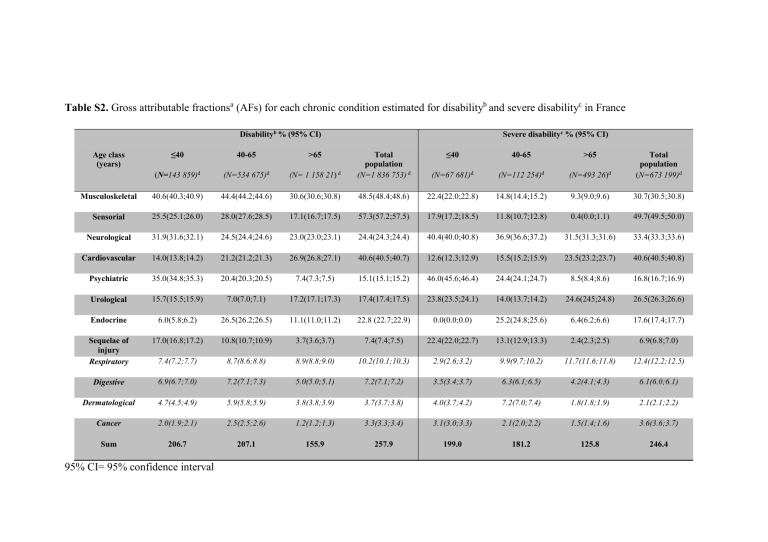
Table S2. Gross attributable fractionsa (AFs) for each chronic condition estimated for disabilityb and severe disabilityc in France Disabilityb % (95% CI) ≤40 40-65 >65 (N=143 859)d (N=534 675)d Musculoskeletal 40.6(40.3;40.9) Sensorial Severe disabilityc % (95% CI) ≤40 40-65 >65 (N= 1 158 21) d Total population (N=1 836 753) d (N=67 681)d (N=112 254)d (N=493 26)d Total population (N=673 199)d 44.4(44.2;44.6) 30.6(30.6;30.8) 48.5(48.4;48.6) 22.4(22.0;22.8) 14.8(14.4;15.2) 9.3(9.0;9.6) 30.7(30.5;30.8) 25.5(25.1;26.0) 28.0(27.6;28.5) 17.1(16.7;17.5) 57.3(57.2;57.5) 17.9(17.2;18.5) 11.8(10.7;12.8) 0.4(0.0;1.1) 49.7(49.5;50.0) Neurological 31.9(31.6;32.1) 24.5(24.4;24.6) 23.0(23.0;23.1) 24.4(24.3;24.4) 40.4(40.0;40.8) 36.9(36.6;37.2) 31.5(31.3;31.6) 33.4(33.3;33.6) Cardiovascular 14.0(13.8;14.2) 21.2(21.2;21.3) 26.9(26.8;27.1) 40.6(40.5;40.7) 12.6(12.3;12.9) 15.5(15.2;15.9) 23.5(23.2;23.7) 40.6(40.5;40.8) Psychiatric 35.0(34.8;35.3) 20.4(20.3;20.5) 7.4(7.3;7.5) 15.1(15.1;15.2) 46.0(45.6;46.4) 24.4(24.1;24.7) 8.5(8.4;8.6) 16.8(16.7;16.9) Urological 15.7(15.5;15.9) 7.0(7.0;7.1) 17.2(17.1;17.3) 17.4(17.4;17.5) 23.8(23.5;24.1) 14.0(13.7;14.2) 24.6(245;24.8) 26.5(26.3;26.6) Endocrine 6.0(5.8;6.2) 26.5(26.2;26.5) 11.1(11.0;11.2) 22.8 (22.7;22.9) 0.0(0.0;0.0) 25.2(24.8;25.6) 6.4(6.2;6.6) 17.6(17.4;17.7) Sequelae of injury Respiratory 17.0(16.8;17.2) 10.8(10.7;10.9) 3.7(3.6;3.7) 7.4(7.4;7.5) 22.4(22.0;22.7) 13.1(12.9;13.3) 2.4(2.3;2.5) 6.9(6.8;7.0) 7.4(7.2;7.7) 8.7(8.6;8.8) 8.9(8.8;9.0) 10.2(10.1;10.3) 2.9(2.6;3.2) 9.9(9.7;10.2) 11.7(11.6;11.8) 12.4(12.2;12.5) Digestive 6.9(6.7;7.0) 7.2(7.1;7.3) 5.0(5.0;5.1) 7.2(7.1;7.2) 3.5(3.4;3.7) 6.3(6.1;6.5) 4.2(4.1;4.3) 6.1(6.0;6.1) Dermatological 4.7(4.5;4.9) 5.9(5.8;5.9) 3.8(3.8;3.9) 3.7(3.7;3.8) 4.0(3.7;4.2) 7.2(7.0;7.4) 1.8(1.8;1.9) 2.1(2.1;2.2) Cancer 2.0(1.9;2.1) 2.5(2.5;2.6) 1.2(1.2;1.3) 3.3(3.3;3.4) 3.1(3.0;3.3) 2.1(2.0;2.2) 1.5(1.4;1.6) 3.6(3.6;3.7) Sum 206.7 207.1 155.9 257.9 199.0 181.2 125.8 246.4 Age class (years) 95% CI= 95% confidence interval a AFs were calculated by use of the Levin formula5: Pe(RR -1) / Pe(RR -1) + 1 where Pe is the prevalence of the disease in the overall population and RR the relative risk of being disabled with the disease. Confidence intervals of AF were calculated with use of the Fleiss formula6 b Disability= any restriction for doing at least one activity of daily living (ADL), with or without technical aid. c Severe disability=inability to perform at least one ADL alone d N=the estimated number of people in the French adult population living in household. Numbers reflect the use of a non-rounded population in calculations. e Self-reported disability= a positive answer to the question "Do you consider that you have a disability?" Diseases with AF<15% in each age group are in italics. They were grouped for AAF calculation under “Other diseases.” Table S2. (continued) Gross attributable fractiona (AF) for each chronic condition estimates for self-reported disabilitye in France e Self-reported disability % (95% CI) ≤40 40-65 >65 (N=804 615)d (N=2 440 94)d (N= 2 473 309)d Total Population (N=5 718 868)d Musculoskeletal 25.4(25.3;25.5) 34.8(34.7;34.9) 26.3(26.2;26.4) 38.7(38.6;38.7) Sensorial 27.7(27.5;27.9) 30.3(30.1;30.5) 18.6(18.3;18.8) 50.3(50.2;50.4) Neurological 14.0(14.0;14.1) 14.2(14.1;14.2) 10.1(10.1;10.2) 12.6(12.6;12.6) Cardiovascular 8.8(8.7;8.8) 17.4(17.3;17.5) 21.7(21.6;21.8) 28.6(28.6;28.7) Psychiatric 20.8(20.7;20.9) 17.6(17.5;17.6) 6.3(6.3;6.4) 14.4(14.4;14.5) Urological 2.5(2.4;2.5) 3.8(3.8;3.8) 9.2(9.1;9.2) 7.9(7.9;8.0) Endocrine 11.0(10.9;11.1) 19.1(19.0;19.1) 10.1(10.1;10.2) 19.3(19.2;19.3) Sequelae of injury 10.1(10.0;10.1) 8.3(8.3;8.4) 2.3(2.3;2.3) 6.4(6.4;6.4) Respiratory 7.4(7.3;7.5) 8.2(8.1;8.2) 6.0(6.0;6.1) 7.9(7.9;7.9) Digestive 4.8(4.7;4.9) 7.2(7.2;7.2) 3.4(3.4;3.4) 6.1(6.1;6.2) Dermatological 2.6(2.6;2.7) 4.7(4.7;4.8) 2.0(2.0;2.0) 2.7(2.7;2.7) Cancer 1.1(1.1;1.1) 2.7(2.7;2.7) 1.6(1.6;1.7) 3.0(3.0;3.1) Sum 136.2 168.3 117.6 197.9

