Figure 3. CVs of Cu, Ni and bulk Cu nanowires
advertisement
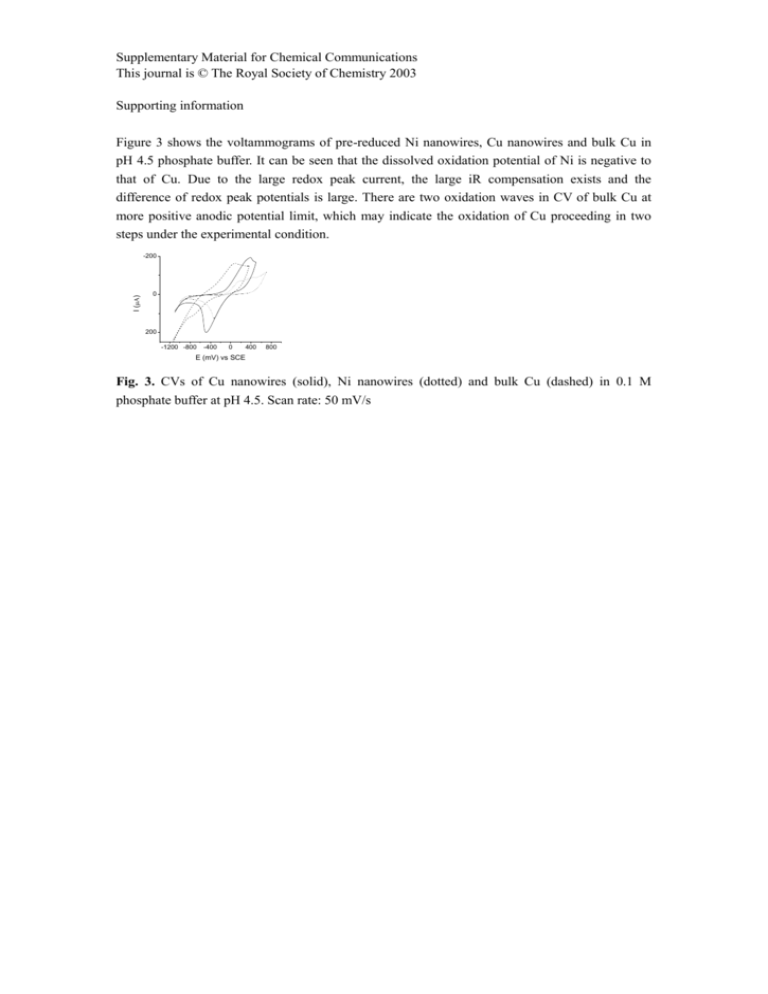
Supplementary Material for Chemical Communications This journal is © The Royal Society of Chemistry 2003 Supporting information Figure 3 shows the voltammograms of pre-reduced Ni nanowires, Cu nanowires and bulk Cu in pH 4.5 phosphate buffer. It can be seen that the dissolved oxidation potential of Ni is negative to that of Cu. Due to the large redox peak current, the large iR compensation exists and the difference of redox peak potentials is large. There are two oxidation waves in CV of bulk Cu at more positive anodic potential limit, which may indicate the oxidation of Cu proceeding in two steps under the experimental condition. I () -200 0 200 -1200 -800 -400 0 400 800 E (mV) vs SCE Fig. 3. CVs of Cu nanowires (solid), Ni nanowires (dotted) and bulk Cu (dashed) in 0.1 M phosphate buffer at pH 4.5. Scan rate: 50 mV/s

