TITLE 1.1. Data set identification. Flux data fallow savannah at West
advertisement

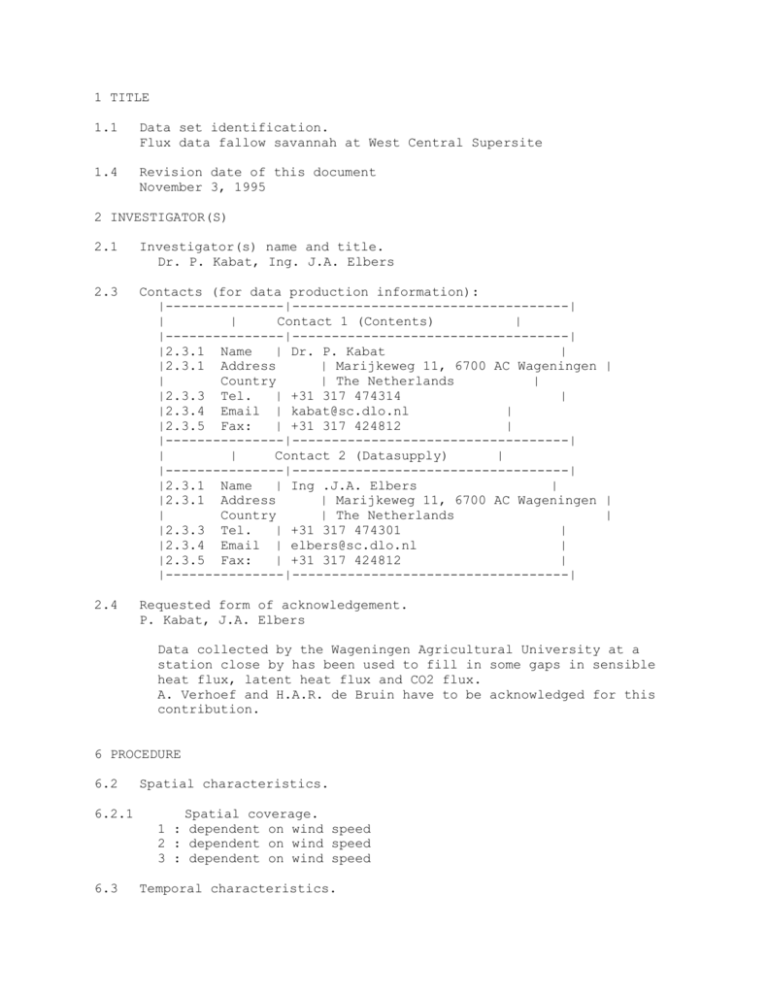
1 TITLE 1.1 Data set identification. Flux data fallow savannah at West Central Supersite 1.4 Revision date of this document November 3, 1995 2 INVESTIGATOR(S) 2.1 Investigator(s) name and title. Dr. P. Kabat, Ing. J.A. Elbers 2.3 Contacts (for data production information): |---------------|-----------------------------------| | | Contact 1 (Contents) | |---------------|-----------------------------------| |2.3.1 Name | Dr. P. Kabat | |2.3.1 Address | Marijkeweg 11, 6700 AC Wageningen | | Country | The Netherlands | |2.3.3 Tel. | +31 317 474314 | |2.3.4 Email | kabat@sc.dlo.nl | |2.3.5 Fax: | +31 317 424812 | |---------------|-----------------------------------| | | Contact 2 (Datasupply) | |---------------|-----------------------------------| |2.3.1 Name | Ing .J.A. Elbers | |2.3.1 Address | Marijkeweg 11, 6700 AC Wageningen | | Country | The Netherlands | |2.3.3 Tel. | +31 317 474301 | |2.3.4 Email | elbers@sc.dlo.nl | |2.3.5 Fax: | +31 317 424812 | |---------------|-----------------------------------| 2.4 Requested form of acknowledgement. P. Kabat, J.A. Elbers Data collected by the Wageningen Agricultural University at a station close by has been used to fill in some gaps in sensible heat flux, latent heat flux and CO2 flux. A. Verhoef and H.A.R. de Bruin have to be acknowledged for this contribution. 6 PROCEDURE 6.2 6.2.1 6.3 Spatial characteristics. Spatial coverage. 1 : dependent on wind speed 2 : dependent on wind speed 3 : dependent on wind speed Temporal characteristics. 6.3.1 Temporal coverage. From day 231 (18/8) to 285 (11/10) 1992 6.3.2 Temporal resolution. 30-minute average 7 OBSERVATIONS 8 DATA DESCRIPTION 8.2 Type of data. 8.2.1 Parameters Column Parameter/Variable name Units ------ ----------------------1 grid_id 2 grid_order 3 observation_date 4 observation_time (hours*100+minutes) 5 sensible heat flux 6 latent heat flux 7 CO2 flux mg/m2/s 8 net radiation above Guiera bushes 9 incoming shortwave radiation 10 reflected shortwave radiation above Guiera 11 soil heat flux afternoon shaded 12 soil heat flux no shading 13 soil heat flux no shading 14 soil heat flux shaded 15 sapflow gauge 1 area averaged 16 sapflow gauge 2 area averaged 8.3 Height (m) ---------- 5.50 5.50 5.50 W/m2 W/m2 1.86 1.72 1.62 -0.01 -0.005 -0.04 -0.008 - W/m2 W/m2 W/m2 W/m2 W/m2 W/m2 W/m2 W/m2 W/m2 Sample database data record. 5154,1,23-AUG-92, 400, -.860E+01, .000E+00, .400E+00, ---- .751E-01, -.178E+02, .156E+01, -.285E+02, -.342E+02, -.363E+02, -.240E+02, .164E+01, .142E+01, 5154,1,23-AUG-92, 430, -.137E+02, -.231E+02, .760E-01, -.217E+02, .000E+00, .156E+01, -.287E+02, -.881E+01, -.374E+02, -.237E+02, .168E+01, .143E+01, 5154,1,23-AUG-92, 500, -.550E+01, .430E+01, .641E-01, -.227E+02, .000E+00, .156E+01, -.257E+02, -.330E+02, -.336E+02, -.203E+02, .164E+01, .137E+01, 5154,1,23-AUG-92, 530, -.610E+01, .250E+01, .257E-01, -.259E+02, .000E+00, .156E+01, -.271E+02, -.338E+02, -.348E+02, -.210E+02, .122E+01, .151E+01,


