MTSS Integrated Case Study Batsche Saturday
advertisement
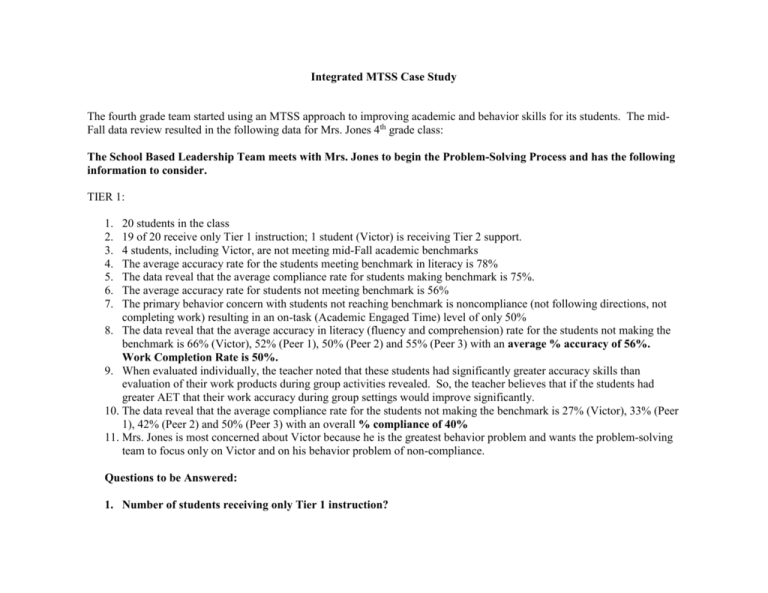
Integrated MTSS Case Study The fourth grade team started using an MTSS approach to improving academic and behavior skills for its students. The midFall data review resulted in the following data for Mrs. Jones 4th grade class: The School Based Leadership Team meets with Mrs. Jones to begin the Problem-Solving Process and has the following information to consider. TIER 1: 1. 2. 3. 4. 5. 6. 7. 20 students in the class 19 of 20 receive only Tier 1 instruction; 1 student (Victor) is receiving Tier 2 support. 4 students, including Victor, are not meeting mid-Fall academic benchmarks The average accuracy rate for the students meeting benchmark in literacy is 78% The data reveal that the average compliance rate for students making benchmark is 75%. The average accuracy rate for students not meeting benchmark is 56% The primary behavior concern with students not reaching benchmark is noncompliance (not following directions, not completing work) resulting in an on-task (Academic Engaged Time) level of only 50% 8. The data reveal that the average accuracy in literacy (fluency and comprehension) rate for the students not making the benchmark is 66% (Victor), 52% (Peer 1), 50% (Peer 2) and 55% (Peer 3) with an average % accuracy of 56%. Work Completion Rate is 50%. 9. When evaluated individually, the teacher noted that these students had significantly greater accuracy skills than evaluation of their work products during group activities revealed. So, the teacher believes that if the students had greater AET that their work accuracy during group settings would improve significantly. 10. The data reveal that the average compliance rate for the students not making the benchmark is 27% (Victor), 33% (Peer 1), 42% (Peer 2) and 50% (Peer 3) with an overall % compliance of 40% 11. Mrs. Jones is most concerned about Victor because he is the greatest behavior problem and wants the problem-solving team to focus only on Victor and on his behavior problem of non-compliance. Questions to be Answered: 1. Number of students receiving only Tier 1 instruction? 2. Number of students who receive Tier 2 instruction? 3. Number of students who receive Tier 3 instruction? 4. % of students who receive only Tier 1 instruction? 5. % of students receiving only Tier 1 instruction who are proficient? 6. % of students receiving Tier 2 instruction who are proficient? 7. Are you happy with the effectiveness of Tier 1? In other, words are you going to focus on problem-solving Tier 1 instruction or at a different level? 8. The teacher wants you to focus on Victor. Do the data suggest that this is the best idea? 9. If not, what will be the focus of your problem-solving? PROBLEM IDENTIFICATION STEP 1. What do you these students to know and be able to do? a. Academic Behavior b. Academic Skills Needed (e.g., follow-directions, on-task for X minutes, Ask questions when help needed?????) 2. Current Level of Performance? a. Academic Skill b. Academic Productivity c. Academic Behavior (compliance?) 3. Desired Level of Performance? a. Academic Skill b. Academic Productivity c. Academic Behavior 4. Gap Determination a. Academic Behavior: Compliance 40% b. Desired: 80% c. GAP: 40 d. 8 Weeks: GAP/TIME=RATE i. 40/8 weeks—5%/week PROBLEM-ANALYSIS STEP 1. Group is unable to complete 80% of seat work assignments BECAUSE ___________ Problem Analysis Worksheet Replacement Behavior Group is unable to complete 80% of seat work assignments BECAUSE Hypothesis Student (Academic Skills/Academic Behaviors) Curriculum (Instructional Strategies/Performance Behaviors) Prediction Statement Assessment Question RIOTS Data Collection Teacher/Student Curriculum Peer Replacement Behavior Hypothesis Classroom Home/Family/Community INTERVENTION DEVELOPMENT Prediction Statement Assessment Question RIOTS Data Collection Intervention Strategy: Time/Days What Who Where Progress Target Monitoring Dates When/What Peformance Strategy 1 Skill Strategy 2 Instructional Bx (e.g., compliance) Performance Bx Week 1 45% Week 2 50% . . . .

