Overview
advertisement
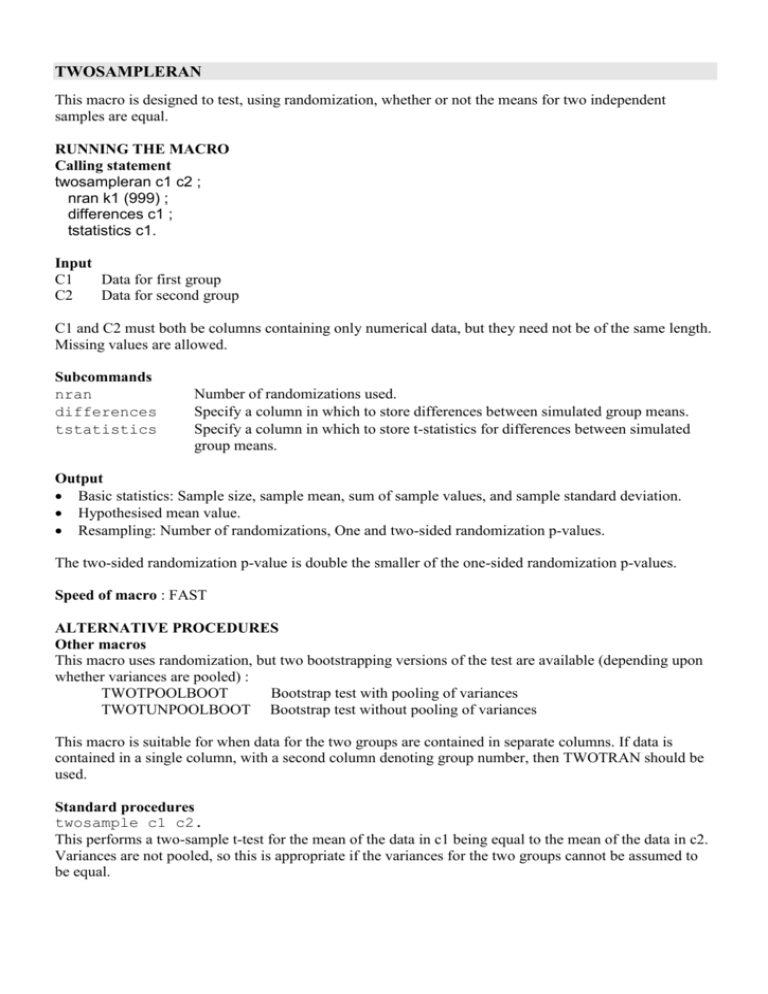
TWOSAMPLERAN This macro is designed to test, using randomization, whether or not the means for two independent samples are equal. RUNNING THE MACRO Calling statement twosampleran c1 c2 ; nran k1 (999) ; differences c1 ; tstatistics c1. Input C1 Data for first group C2 Data for second group C1 and C2 must both be columns containing only numerical data, but they need not be of the same length. Missing values are allowed. Subcommands nran differences tstatistics Number of randomizations used. Specify a column in which to store differences between simulated group means. Specify a column in which to store t-statistics for differences between simulated group means. Output Basic statistics: Sample size, sample mean, sum of sample values, and sample standard deviation. Hypothesised mean value. Resampling: Number of randomizations, One and two-sided randomization p-values. The two-sided randomization p-value is double the smaller of the one-sided randomization p-values. Speed of macro : FAST ALTERNATIVE PROCEDURES Other macros This macro uses randomization, but two bootstrapping versions of the test are available (depending upon whether variances are pooled) : TWOTPOOLBOOT Bootstrap test with pooling of variances TWOTUNPOOLBOOT Bootstrap test without pooling of variances This macro is suitable for when data for the two groups are contained in separate columns. If data is contained in a single column, with a second column denoting group number, then TWOTRAN should be used. Standard procedures twosample c1 c2. This performs a two-sample t-test for the mean of the data in c1 being equal to the mean of the data in c2. Variances are not pooled, so this is appropriate if the variances for the two groups cannot be assumed to be equal. twosample C1 C2; pooled. This performs a two-sample t-test for the mean of the data in c1 being equal to the mean of the data in c2. Variances are pooled, so this is only appropriate if the variances for the two groups can be assumed to be equal. TECHNICAL DETAILS Null hypothesis :We test the null hypothesis that the mean for the first group is equal to the mean for the second group. Randomization procedure :We fix the data value for each individual, and fix the size of the groups. We then randomize the allocation of individuals to groups, since under the null hypothesis this allocation will be random. Test-statistic : We use the difference between the two sample group means as the test-statistic. REFERENCES MANLY, F.J. (1997) Randomization, bootstrap and Monte Carlo methods in biology, Chapman and Hall, London (Chapter 6). WORKED EXAMPLE FOR TWOSAMPLERAN Name of dataset LIZARDS Description The data consists of the quantity of dry biomass of Coleoptera in the stomachs of two size morphs of the Eastern Horned Lizard, Phrynosoma douglassi brevirostre. The data were collected by Powell and Russell, and are analysed by Manly (1997) using a two sample randomization test. Data is available for 24 lizards in the first size morph (adult males and yearling females) and 21 lizards in the second size morph (adult females). Our source MANLY, F.J. (1997) Randomization, bootstrap and Monte Carlo methods in biology, Chapman and Hall, London. Original source POWELL, G.L. & RUSSELL, A.P. (1984), The diet of the eastern short-horned lizard (Phrynosoma douglassi brevirostre) in Alberta and its relationship to sexual size dimorphism, Canadian Journal of Zoology, 62, pp. 428-440. POWELL, G.L. & RUSSELL, A.P. (1985), Growth and sexual size dimorphisms in Alberta populations of the eastern short-horned lizard, Phrynosoma douglassi brevirostre, Canadian Journal of Zoology, 63, pp. 139-154. Data Number of observations = 45 Number of variables = 2 For each size morph group, data are given. Group 1 (Adult males and yearling females) 256 209 0 0 0 44 49 117 6 0 0 75 34 13 90 0 32 0 205 332 0 31 0 0 Group 2 (Adult females) 2 2 0 89 0 0 0 163 286 179 19 142 100 0 432 3 843 0 158 443 311 232 179 Worksheet C1 Data for group 1 C2 Data for group 2 Aims of analysis To investigate whether stomach biomass is different for lizards in size morph 1 and lizards in size morph 2. Minitab output : Standard procedure, without pooling MTB > Retrieve "N:\resampling\Examples\Lizards.MTW". Retrieving worksheet from file: N:\resampling\Examples\Lizards.MTW # Worksheet was saved on 03/07/01 16:32:34 Results for: Lizards.MTW MTB > twosample c1 c2 Two-Sample T-Test and CI: Group1, Group2 Two-sample T for Group1 vs Group2 N Group1 24 Group2 21 Mean 62.2 170 StDev SE Mean 94.1 19 209 46 Difference = mu Group1 - mu Group2 Estimate for difference: -108.2 95% CI for difference: (-209.6, -6.9) T-Test of difference = 0 (vs not =): T-Value = -2.19 P-Value = 0.037 DF = 27 Minitab output : Standard procedure, with pooling MTB > twosample c1 c2 ; SUBC> pooled. Two-Sample T-Test and CI: Group1, Group2 Two-sample T for Group1 vs Group2 N Group1 24 Group2 21 Mean 62.2 170 StDev SE Mean 94.1 19 209 46 Difference = mu Group1 - mu Group2 Estimate for difference: -108.2 95% CI for difference: (-203.4, -13.0) T-Test of difference = 0 (vs not =): T-Value = -2.29 P-Value = 0.027 DF = 43 3 Both use Pooled StDev = 158 Randomization procedure (with pooling) MTB > Retrieve "N:\resampling\Examples\Lizards.MTW". Retrieving worksheet from file: N:\resampling\Examples\Lizards.MTW # Worksheet was saved on 07/03/01 04:32:34 PM Results for: Lizards.MTW MTB > % N:\resampling\library\twosampleran c1 c2 ; SUBC> nran 999 ; SUBC> differences c4 ; SUBC> tstatistics c5. Executing from file: N:\resampling\library\twosampleran.MAC Two-sample randomization test Data Display (WRITE) Number of observations in group 1 24 Number of observations in group 2 21 Data mean for group 1 62.21 Data mean for group 2 170.4 Standard deviation for group 1 94.11 Standard deviation for group 2 208.6 Observed difference in means Observed t-statistic -2.19 -108.2 Number of randomization samples 999 P-value for one-sided test with alternative: mean(group 1)>mean(group2) 0.9880 P-value for one-sided test with alternative: mean(group 1)<mean(group2) 0.0130 P-value for two-sided test 0.0260 Modified worksheet C4 A column containing 999 differences between sample means, one for each randomized dataset C5 A column containing 999 t-statistics for differences, one for each randomized dataset Discussion Standard (two-sided) p-values are 0.037 (if we do not pool variances) or 0.027 (if we pool variances), whilst our randomization p-value is 0.026. All of these values are similar, and provide reasonable evidence for a different in stomach biomass between males and females. Looking at the data (and onesided p-values) it is clear that stomach biomass is higher for lizards in size morph 2. 4
