October 28, 2000
advertisement

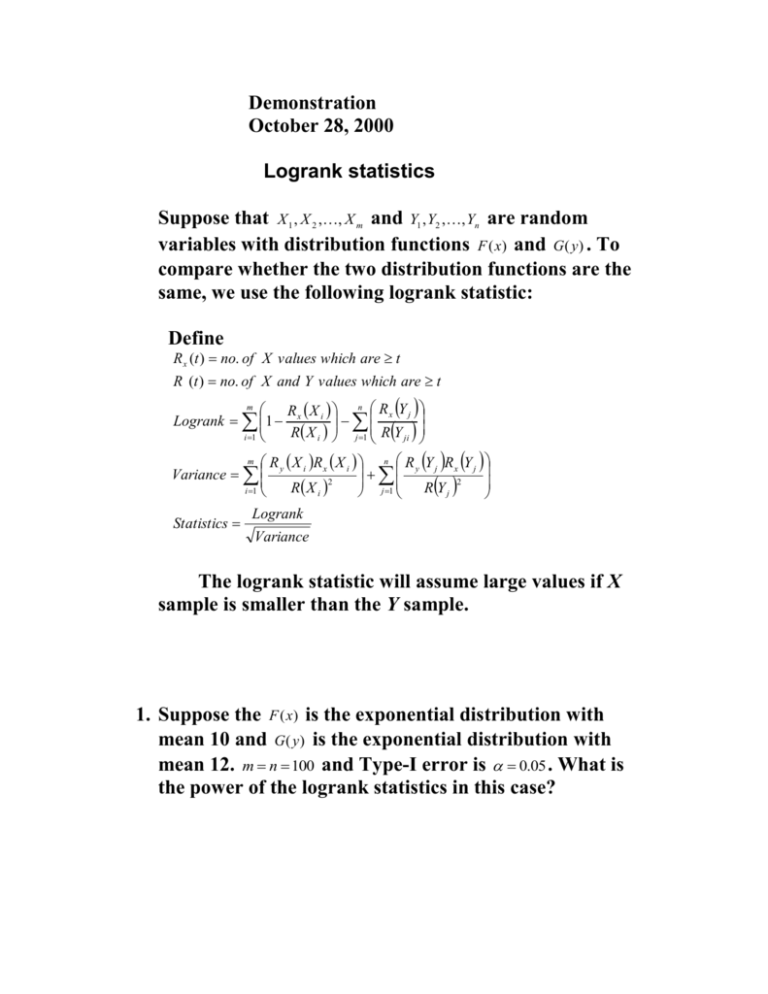
Demonstration October 28, 2000 Logrank statistics Suppose that X 1 , X 2 ,, X m and Y1 , Y2 ,, Yn are random variables with distribution functions F (x) and G( y) . To compare whether the two distribution functions are the same, we use the following logrank statistic: Define R x (t ) no. of X values which are t R (t ) no. of X and Y values which are t m R X n R x Y j Logrank 1 x i R X i j 1 R Y ji i 1 m R X R X n R Y R Y y i x i y j x j Variance 2 2 j 1 R X i R Y j i 1 Logrank Statistics Variance The logrank statistic will assume large values if X sample is smaller than the Y sample. 1. Suppose the F (x) is the exponential distribution with mean 10 and G( y) is the exponential distribution with mean 12. m n 100 and Type-I error is 0.05 . What is the power of the logrank statistics in this case? 2. Boundary: Haybittle: 3 Number of interim analyses: k=9 Time(s) of the k interim analyses: 1 1.5 2 2.5 3 3.5 4 4.5 5 Number of Statistics: 1 rho(s) of the ih statistic(s): 1 tau(s) of the ih statistic(s): 0 the number of simulations in each iteration: 500 Input the type-I error: .05 Accrual rate: 300 Input 1 or 2 sided test, type 1 or 2: 2 Input the b in the repeated significance test: b should be larger than 0: 3 the number of intervals to specify the baseline survival function: 1 Input the right endpoint(s) of the J interval(s), in increasing order of magnitude, where J is the number in the last input: 5 Input the J survival probabilities at the points specified in the last input: The survival probabilities in between those points are interpolated using the exponential distribution function:.5 Input the alternative survival function. Input the number of intervals (>=1) to specify the alternative survival function: Up to 20 are allowed: 5 Input the I right endpoint(s) of interval(s) for specifying alternative survival function, where I is the number in the last input: 1 2 3 4 5 the I survival probabilities: .96 .88 .80 .70 .60 Input the censoring survival function for the baseline (control) group. the number of intervals :1 Input the right endpoint(s) of interval(s): 5 Input the survival probabilities:.933 Input the censoring survival distribution for alternative (treatment) group. Input the number of intervals: 1 Input the right endpoint(s) of interval(s): 5 Input the survival probabilities: .937 Input the drop-in (out) rate. Input the number of times to specify the drop-in rate(s): 5 Input the time point(s) for specifying drop-in rate(s): 0 1 2 3 4 Input the drop-in rate(s): .03 .03 .03 .03 .03 Input the number of times to specify the drop-out rate(s): 5 Input the time point(s) for specifying drop-out rate(s): 0 1 2 3 4 Input the drop-out rate(s): .10 .10 .10 .10 .10


