size development, live span and fecundity of offspring derived from
advertisement
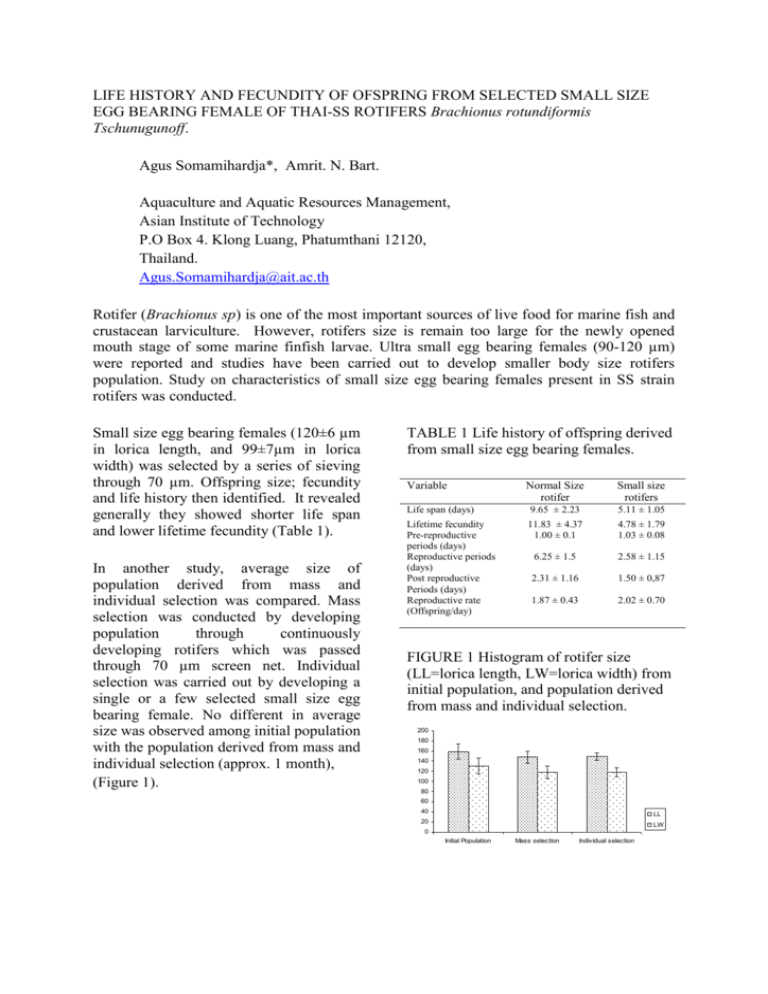
LIFE HISTORY AND FECUNDITY OF OFSPRING FROM SELECTED SMALL SIZE EGG BEARING FEMALE OF THAI-SS ROTIFERS Brachionus rotundiformis Tschunugunoff. Agus Somamihardja*, Amrit. N. Bart. Aquaculture and Aquatic Resources Management, Asian Institute of Technology P.O Box 4. Klong Luang, Phatumthani 12120, Thailand. Agus.Somamihardja@ait.ac.th Rotifer (Brachionus sp) is one of the most important sources of live food for marine fish and crustacean larviculture. However, rotifers size is remain too large for the newly opened mouth stage of some marine finfish larvae. Ultra small egg bearing females (90-120 µm) were reported and studies have been carried out to develop smaller body size rotifers population. Study on characteristics of small size egg bearing females present in SS strain rotifers was conducted. Small size egg bearing females (120±6 µm in lorica length, and 99±7µm in lorica width) was selected by a series of sieving through 70 µm. Offspring size; fecundity and life history then identified. It revealed generally they showed shorter life span and lower lifetime fecundity (Table 1). In another study, average size of population derived from mass and individual selection was compared. Mass selection was conducted by developing population through continuously developing rotifers which was passed through 70 µm screen net. Individual selection was carried out by developing a single or a few selected small size egg bearing female. No different in average size was observed among initial population with the population derived from mass and individual selection (approx. 1 month), (Figure 1). TABLE 1 Life history of offspring derived from small size egg bearing females. Variable Normal Size rotifer Small size rotifers Life span (days) 9.65 ± 2.23 5.11 ± 1.05 Lifetime fecundity Pre-reproductive periods (days) Reproductive periods (days) Post reproductive Periods (days) Reproductive rate (Offspring/day) 11.83 ± 4.37 1.00 ± 0.1 4.78 ± 1.79 1.03 ± 0.08 6.25 ± 1.5 2.58 ± 1.15 2.31 ± 1.16 1.50 ± 0,87 1.87 ± 0.43 2.02 ± 0.70 FIGURE 1 Histogram of rotifer size (LL=lorica length, LW=lorica width) from initial population, and population derived from mass and individual selection. 200 180 160 140 120 100 80 60 40 LL 20 LW 0 Initial Population Mass selection Individual selection
