RNA Treatment
advertisement
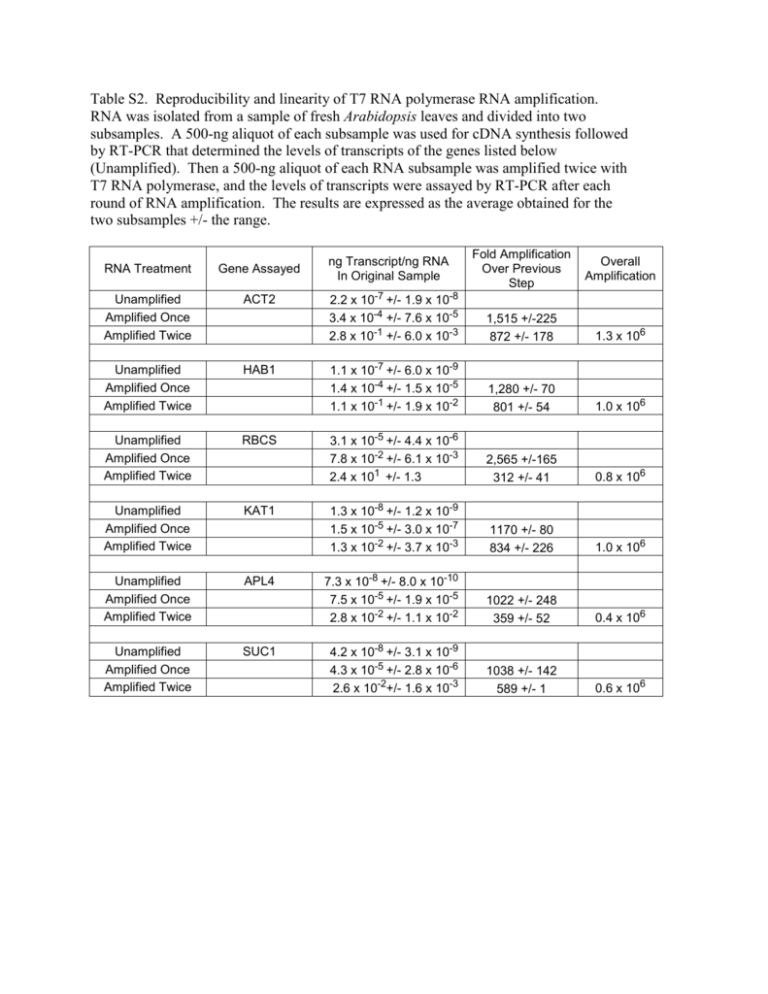
Table S2. Reproducibility and linearity of T7 RNA polymerase RNA amplification. RNA was isolated from a sample of fresh Arabidopsis leaves and divided into two subsamples. A 500-ng aliquot of each subsample was used for cDNA synthesis followed by RT-PCR that determined the levels of transcripts of the genes listed below (Unamplified). Then a 500-ng aliquot of each RNA subsample was amplified twice with T7 RNA polymerase, and the levels of transcripts were assayed by RT-PCR after each round of RNA amplification. The results are expressed as the average obtained for the two subsamples +/- the range. RNA Treatment Gene Assayed Unamplified Amplified Once Amplified Twice ACT2 Unamplified Amplified Once Amplified Twice HAB1 Unamplified Amplified Once Amplified Twice RBCS Unamplified Amplified Once Amplified Twice KAT1 Unamplified Amplified Once Amplified Twice APL4 Unamplified Amplified Once Amplified Twice SUC1 ng Transcript/ng RNA In Original Sample Fold Amplification Over Previous Step Overall Amplification 2.2 x 10⁻⁷ +/- 1.9 x 10⁻⁸ 3.4 x 10⁻⁴ +/- 7.6 x 10⁻⁵ 2.8 x 10⁻¹ +/- 6.0 x 10⁻³ 1,515 +/-225 872 +/- 178 1.3 x 10⁶ 1.1 x 10⁻⁷ +/- 6.0 x 10⁻⁹ 1.4 x 10⁻⁴ +/- 1.5 x 10⁻⁵ 1.1 x 10⁻¹ +/- 1.9 x 10⁻² 1,280 +/- 70 801 +/- 54 1.0 x 10⁶ 3.1 x 10⁻⁵ +/- 4.4 x 10⁻⁶ 7.8 x 10⁻² +/- 6.1 x 10⁻³ 2.4 x 101 +/- 1.3 2,565 +/-165 312 +/- 41 0.8 x 10⁶ 1.3 x 10⁻⁸ +/- 1.2 x 10⁻⁹ 1.5 x 10⁻⁵ +/- 3.0 x 10⁻⁷ 1.3 x 10⁻² +/- 3.7 x 10⁻³ 1170 +/- 80 834 +/- 226 1.0 x 10⁶ 7.3 x 10⁻⁸ +/- 8.0 x 10⁻¹⁰ 7.5 x 10⁻⁵ +/- 1.9 x 10⁻⁵ 2.8 x 10⁻² +/- 1.1 x 10⁻² 1022 +/- 248 359 +/- 52 0.4 x 10⁶ 4.2 x 10⁻⁸ +/- 3.1 x 10⁻⁹ 4.3 x 10⁻⁵ +/- 2.8 x 10⁻⁶ 2.6 x 10⁻²+/- 1.6 x 10⁻³ 1038 +/- 142 589 +/- 1 0.6 x 10⁶
