120
advertisement
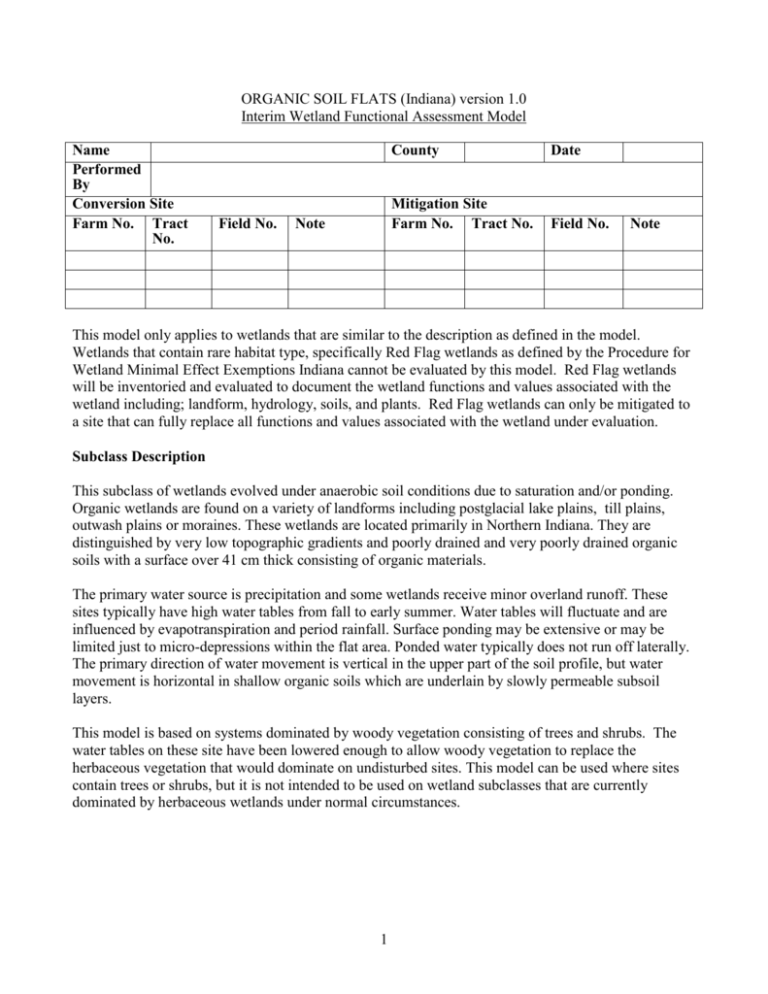
ORGANIC SOIL FLATS (Indiana) version 1.0 Interim Wetland Functional Assessment Model Name Performed By Conversion Site Farm No. Tract No. Field No. Note County Date Mitigation Site Farm No. Tract No. Field No. Note This model only applies to wetlands that are similar to the description as defined in the model. Wetlands that contain rare habitat type, specifically Red Flag wetlands as defined by the Procedure for Wetland Minimal Effect Exemptions Indiana cannot be evaluated by this model. Red Flag wetlands will be inventoried and evaluated to document the wetland functions and values associated with the wetland including; landform, hydrology, soils, and plants. Red Flag wetlands can only be mitigated to a site that can fully replace all functions and values associated with the wetland under evaluation. Subclass Description This subclass of wetlands evolved under anaerobic soil conditions due to saturation and/or ponding. Organic wetlands are found on a variety of landforms including postglacial lake plains, till plains, outwash plains or moraines. These wetlands are located primarily in Northern Indiana. They are distinguished by very low topographic gradients and poorly drained and very poorly drained organic soils with a surface over 41 cm thick consisting of organic materials. The primary water source is precipitation and some wetlands receive minor overland runoff. These sites typically have high water tables from fall to early summer. Water tables will fluctuate and are influenced by evapotranspiration and period rainfall. Surface ponding may be extensive or may be limited just to micro-depressions within the flat area. Ponded water typically does not run off laterally. The primary direction of water movement is vertical in the upper part of the soil profile, but water movement is horizontal in shallow organic soils which are underlain by slowly permeable subsoil layers. This model is based on systems dominated by woody vegetation consisting of trees and shrubs. The water tables on these site have been lowered enough to allow woody vegetation to replace the herbaceous vegetation that would dominate on undisturbed sites. This model can be used where sites contain trees or shrubs, but it is not intended to be used on wetland subclasses that are currently dominated by herbaceous wetlands under normal circumstances. 1 Distinguishing Characteristics This subclass differs from mineral soil flats in the region in that most of the mineral wetlands consist of primarily mineral soils and vary in soil biochemical conditions. The lack of significant surface inflow distinguishes them from depressional wetlands. The reliance upon precipitation as opposed to groundwater, and the low topographic gradient, distinguishes flats from slope wetlands. As opposed to riverine wetlands, the flats are primarily dependent upon precipitation with the primary surface water movement being vertical fluctuation as opposed to unidirectional horizontal flow. In some cases, wetlands in these other classes may appear similar to flats and may even function similarly. For example, direct precipitation may be equal to surface runoff as a primary water source for very large depressional wetlands. Extensive drainage in the surrounding landscape may have altered the original hydrologic regimes within the wetlands of this subclass. Important Functions Due to their flat gradient and fluctuating water tables, the primary hydrologic function of organic flats is to store subsurface water. Surface water storage is a minor component and depends upon the amount of surface ponding. The fluctuating water tables are conducive to rapid biogeochemical nutrient cycling. Large amounts of organic carbon may be stored in the herbaceous biomass and organic soils present in mature ecosystems of this type. These wetlands can occur as a portion of extensive wetlands which provided important habitat for a variety of plant and animal species to isolated depression in woods and fields. Pools within the woods serve as important amphibian breeding sites; several migratory birds use these as nesting areas. MODEL FUNCTIONS AND VARIABLE LISTING HYDROLOGICAL FUNCTION 1 - Water Storage Definition: Capacity of a wetland to temporarily store surface and sub-surface water for long durations; associated with standing water not moving over the surface. Sources of water are direct precipitation, and to a lesser extent, overland flow and lateral subsurface flow. Effects On-site: Replenishes soil moisture; detains water for chemical transformations; maintains vegetative composition; maintains seasonally-ponded habitat for herptiles and aquatic invertebrates; and influences soil characteristics. Effects Off-site: Improves water quality and maintains seasonal flow distribution. Variables: Vduration, V%_ponded, Vwater_table, Vavail_H2O Index of Function: (Vduration +V%_ponded + Vwater_table + Vavail_H2O)/4 BIOGEOCHEMICAL FUNCTION 1 - Nutrient Uptake Definition: Abiotic and biotic processes that convert nutrients and other elements from one form to another; primarily recycling processes. Effects On-site: removes sediments, nutrients, and contaminants; Net effects of recycling are elemental balances between gains through import processes and losses through hydraulic export, efflux to the atmosphere, and long-term retention in persistent biomass and sediments. 2 Effects Off-site: To the extent that nutrients are held on-site by recycling, they will be less susceptible to export downstream. This reduces the level of nutrient loading off-site. Variables: Vstrata, Vturnover, Vcanopy Index of Function: The lesser of: (Vstrata + Vcanopy)/2 or Vturnover BIOGEOCHEMICAL FUNCTION 2 - Long-term Storage of Nutrients and Organic Compounds Definition: The storage of nutrients and organic carbon in the living and dead biomass above the soil and within the soil profile. Effects On-site: The net effect of carbon storage is long-term retention in persistent biomass and in organic matter in the soil profile. Effects Off-site: Nutrients are held on-site and are less susceptible to transport. Variables: Vbasal_area, Vturnover, Vsoil_OM, Vsnag Index of Function: (Vbasal_area +Vturnover + Vsoil_OM + Vsnags)/4 HABITAT FUNCTION 1 - Maintain Characteristic Plant Community Definition: Species composition and physical characteristics of living plant biomass. The emphasis is on the dynamics and structure of plant community as revealed by the dominant species of trees, shrubs, saplings, and ground cover, and by the physical characteristics of vegetation. Effects On-site: Converts solar radiation and carbon dioxide into complex organic compounds that provide energy to drive food webs. Provides seeds for regeneration. Provides habitat for nesting, resting, refuge, and escape cover for animals. Creates micro-climatic conditions that support completion of life histories of plants and animals. Provides organic matter for soil development and soil related nutrient cycling processes. Creates both long- and short- term habitat for resident or migratory animals. Effects off-site: Provides a source of propagules to maintain species composition and/or structure of adjacent wetlands and supplies propagules for colonization of nearby degraded systems. Provides food and cover for animals from adjacent ecosystems. Provides corridors (migratory pathways) between habitats, enhances species diversity and ecosystem stability, and provides habitat and food for migratory and resident animals. Variables: Vcomp, Vcanopy, Vstrata, Vmaturity, Vturnover Index of Function: (Vcomp + Vstrata + Vturnover + Vcanopy + Vmaturity)/5 HABITAT FUNCTION 2 - Maintain Wildlife Habitat Structure Definition: The capacity of a wetland to support animal populations and guilds by providing characteristic habitats. Effects On-site: Provides potential feeding, resting, and nesting sites for vertebrates and invertebrates. Regulates and moderates fluctuations in temperature. Provides characteristic habitat to support a diverse assemblage of organisms dependent upon this wetland type. Affects all ecosystem processes. Effects Off-site: Provides habitat heterogeneity to landscape, provides habitat for wide-ranging and migratory animals, provides a corridor for gene flow between separated populations, and allows progeny to exploit new areas. Variables: V%_ponded, Vstrata, Vsnags, Vmaturity, Vcomp Index of Function: (V%_ponded + Vsnags + Vcomp + Vstrata + Vmaturity)/5 3 HABITAT FUNCTION 3 - Maintain Habitat Interspersion, Quality, and Connectivity Definition: The capacity for all organisms to be provided with diverse and contiguous areas of food and cover. Effects On-site: Provides maintenance of habitat, species, and gene pool diversity. Effects Off-site: Provides habitat heterogeneity to landscape, provides habitat for wide-ranging and migratory animals, provides a corridor for gene flow between separated populations, and allows progeny to exploit new areas. Variables: Vcore, Vconnect, Vcontiguous_cover Index of Function: [(Vcontiguous_cover)2 + Vmigrate + Vconnect]/4 WORKSHEETS FOR SCORING WETLAND FUNCTION VARIABLES For each of the variables listed below, choose the described condition that most nearly matches the site under consideration. V1 Vduration Presence or indication that the wetland surface is ponded for a period of >7 days . Possible field indicators of hydrology include (Check all that apply): bare soil areas due to inundation aerial photography water stained leaves wrack lines water rings on trees direct observations obligate hydrophytic vegetation soil Survey Data A. B. B. D. C. Four or more indicators are present or direct observation can document 7 days of ponding. Three or more indicators are present. Two indicators are present. One indicator is present. Hydrology has been altered to prevent or reduce ponding. Examples include evidence of surface ditches, tile drains, and fill. Restoration is possible. E. Restoration is not possible to due site constraints. 1.0 0.75 0.50 0.25 0.1 0.0 V2 V% ponded Variable is scored by measurement or estimate of the extent of ponding on the wetland surface which indicates ponding for >7 days. The variable is also used in Habitat Function #2 as an indicator of canopy gap. A. >50% of area is ponded. 1.0 B. 10-50% of area is ponded. 0.5 C. <10% of area is ponded. 0.1 D. No evidence of ponding. 0.0 Restoration not possible 4 V3 Vwater_table Fluctuations in the water table as indicated to the depth of the seasonal high water table. The water table of organic flat systems undergo drawdowns due to evapotranspiration and drainage, and rises due to precipitation. Drawdowns of the water table combine with pore space to provide potential volume for water storage below the ground surface. A. Hydrology has not been significantly altered by drainage structures 1.0 B. Wetland hydrology has been modified by drainage structures but the site is not 0.5 considered significantly altered (includes FW and FWP) C. Wetland hydrology has been modified by drainage structures, and the site is considered to be significantly altered. This also includes Prior Converted wetland 0.1 (PC). Restoration is possible. D. Evaluation area is such that restoration is not possible. 0.0 V4 Vavail_H2O Available Water Capacity (AWC) is the volume of water available to plants. It is the amount of water held between field capacity and wilting point, with corrections for salinity, fragments, and rooting depth. AWC is based on an average of the top 40” of soil or to a limiting layer. A. Typic Subgroups Available Water Capacity is 0.4 in./in. 1.0 B. Terric Subgroups Available Water Capacity is 0.30-0.39 in./in. 0.5 C. Linmic Subgroups Soils compacted, or AWC 0.20-0.29 in./in. 0.25 D. Shallow mucks Available Water Capacity is<0.20 in./in. 0.1 E. Soils replaced by substrate with negligible pore space (e.g. 0.0 concrete, asphalt). Restoration is not possible. V5 Vstrata Mature forested wetlands are usually vertically stratified. Forest organisms are primarily associated with a specific strata. Differences in structure between sites likely represent differences in animal composition between the sites as well. In fact, more spatially stratified communities often contain more species. A. Four vegetative strata present (trees, shrubs, vines, and herbaceous). 1.0 B. Three vegetative strata present. 0.75 C. Two vegetative strata present. 0.5 D. One perennial vegetative strata present. 0.25 E. Area converted to row crop agriculture; restoration is possible. 0.1 F. Area converted to row crop agriculture; restoration not possible. 0.0 5 V6 Vcanopy This is a measure of the continuity of the upper layers of the forest canopy. It is assumed the more complete the canopy cover the more efficient the wetland is at nutrient cycling regardless of the maturity of the stand. Stands with canopy coverage of 80-100% provide optimal habitat for forest wildlife. A. Tree canopy cover >80%. 1.0 B. Tree canopy cover 50-80%. 0.5 C. Tree canopy 10-50% 0.25 D. Site is not forested or has a tree canopy <10% potential for recovery 0.1 E. No tree canopy; no potential for recovery (site not suited for trees) 0.0 V7 Vturnover Detrital stocks are represented by down and dead woody debris, and organic debris on the forest floor. Standing stocks of detritus are assumed to be proportional to annual turnover. Most of the annual nutrient cycling occurs at the surface and subsurface levels, therefore, organic debris found on the ground as coarse woody debris and as part of the soil profile are indicative of the active biomass fraction and are representative of annual detrital turnover in the system. An appropriate number of sample plots will be taken to calculate the final score for this variable. Indicators include: Downed and dead woody debris Leaf litter layer Snags A. Three indicators are present. 1.0 B. Two indicators are present. 0.50 C. One indicator is present. 0.25 D. Area barren of woody debris potential for recovery. 0.1 E. Area barren of all elements; no potential for recovery. 0.0 V8 Vbasal area This is a measurement of the average tree basal area within the evaluation area. Trees are defined as greater then 4 inches DBH. Basal area is proportional to above ground biomass of trees and is a dependable indication of forest maturity. In mineral flat forests, basal area and stem density both increase in early succession. Thereafter, tree density decreases, and, as the forest reaches maturity, the rate of increase of basal area diminishes to steady-state conditions. A. Basal area >100 sq. ft. 1.0 B. Basal area 70 -100 sq. ft. 0.75 C. Basal area 40-70 sq. ft.; forested site 0.50 D. Basal area <40 sq. ft.; forested site >300 trees/acre 0.25 E. Restoration possible, e.g. PC, FW, etc. 0.1 F. No trees present; restoration not possible. 0.0 6 V9 Vsoil_OM This variable is defined as the organic matter (OM) content of the upper 51 inches of the soil profile. A. B. C. D. E. Typic Subgroups, e.g. Houghton Terric Subgroups, e.g. Palms, Adrian Limnic Subgroups, e.g. Muskego Shallow mucks, e.g. Antung Restoration is not possible due to site constraints. 1.0 0.5 0.25 0.1 0.0 V10 Vcomp This variable is defined using 1/10th acre plots for the tree strata to determine the dominant tree species. Native tree species are present to fully stock the site, e.g. the site would be considered as forested. (also includes seedlings). This variable we be calculated using an average for the site if applicable. The 50/20 rule will be used. An appropriate number of sample plots will be taken to calculate the final score for this variable. A ≥4 species are present. 1.0 B. 3 species are present. 0.75 C. 2 species are present, res. 0.50 D. 1 species is present. 0.25 E. Site is not fully stocked with trees e.g. cropland, pasture etc. 0.1 F. Restoration is not possible. 0.0 V11 Vmaturity Standing and mature or dying trees provide nesting habitat for a variety of animal species, including invertebrates, birds, reptiles, amphibians, and mammals. Mature trees provide a significant amount of food for wildlife species as well as leaf/woody debris for the nutrient cycle. An appropriate number of sample plots will be taken to calculate the final score for this variable. A. >5 trees/ac. >16 inches DBH 1.0 B. 2-4 trees/ac. >16 inches DBH or, 0.75 >5 trees/ac. >12 inches DBH C. >30 trees/ac. >6 inches DBH 0.5 D. >300 stems/ac (including trees, shrubs, and seedlings) 0.25 E. No trees present; restoration possible, e.g. ag. land. 0.1 F. No trees present; restoration not possible. 0.0 V12 Vsnags This variable is defined as the density of standing dead trees (>4 inches DBH and >6 feet tall). Standing dead trees (snags) are a normal component of forested wetlands. The density of standing dead trees relates to the suitability of a site as wildlife habitat due to the large number of species that forage on, and nest and den in snags. It may also provide an insight into the hydrology of the site. More standing dead trees than a typical site might show an increase in ponding on the site. A. >5 snags/ac. 1.0 B. 2-5 snags/ac. 0.5 C. 1 snags/ac. 0.25 D. Ag. land restoration possible. 0.1 E. No snags present; restoration not possible. 0.0 7 V13 Vmigrate This variable considers that small woodlots (3-5 acres) are important as migratory stop over sites for forest-interior bird species. Acreage for this variable includes the wetland and contiguous woodland associated with the wetland. Area calculations can be made directly from an NWI or topographic map, or from aerial photos. A. B. C. D. >5 acre woodlot. 3 - 5 acre woodlot. 2 - 3 acre woodlot. 2 < acre woodlot. 1.0 0.5 0.1 0.0 V14 Vcontig Heterogeneity in distribution and abundance of organisms is inherent at all scales in every natural ecosystem. Any measure of ecosystem attributes must consider the appropriate scale and sample size in which to measure those attributes in order to understand ecosystem processes. Patchiness of vegetation (lack of contiguous cover types) affects the types and abundance of trophic interactions, energy flow, and competitive interactions of animals. These processes in turn affect animal populations. A. The wetland is part of a larger block (>40 acres) of contiguous upland and/or 1.0 wetland forest which is non-fragmented and has few non-natural breaks. B. Wetland is part of a 30-40 acre block as above. 0.75 C. Wetland is part of a 20-30 acre block as above. 0.5 D. Wetland is part of a 10-20 acre block as above. 0.25 E. Wetland is part of a block <10 acres, or is part of a highly fragmented larger 0.1 block; restoration is possible. Include PC that and non wetlands. F. Wetland is part of a block <10 acres, or is part of a highly fragmented larger 0.0 block: restoration is not possible (Example: urban area). V15 Vconnect This variable is defined as the distance from the wetland’s perimeter to other “suitable” habitat for wildlife. Many species of wildlife that are common inhabitants of forested wetlands also may use other habitat such as upland forests. This variable is assessed by measuring the distance from the wetland to other types of wetlands, to upland forest habitat, or to other communities capable of providing habitat for at least some of the species typically associated with forested wetlands. At least 20% of the perimeter of the wetland being evaluated must meet the described distance measurements. Minimize size of woods to be connected to is 3 acres. A. A direct connection of continuous woody or shrubby cover ≥50’ in width is present. 1.0 Examples include hedge rows, fence rows, windbreaks, etc. B. A direct connection of continuous woody or shrubby cover 50’< in width is present. 0.75 Examples include hedge rows, fence rows, windbreaks, etc. C. A direct connection does not exist, but suitable habitat is <1/4 mile from 0.50 the wetland perimeter.. D. A direct connection does not exist, but suitable habitat is 1/4-1/2 mile 0.25 from the wetland perimeter. E. A direct connection does not exist, but suitable habitat is >1/2 0.1 from the wetland perimeter. Include PC that and non wetlands. F. Site cannot be restored, e.g. urban land etc. 0.0 8
