Part III: Sample Chapter Tests and Answers
CHAPTER 11 TEST
157
FORM A
PAGE 1
First classify the problem as one of the following:
Chi-square test of independence
Chi-square goodness of fit
Chi-square for testing or estimating 2 or
F test for two variances
One-way ANOVA
Two-way ANOVA
Then, in each of the problems, when a test is to be performed, do the following:
Give the value of the level of significance.
State the null and alternate hypotheses.
Find the sample test statistic and degrees of freedom.
Find or estimate the P value of the sample test statistic.
Make a conclusion.
Interpret the conclusion in the context of the application.
In the case of one-way ANOVA, make a summary table.
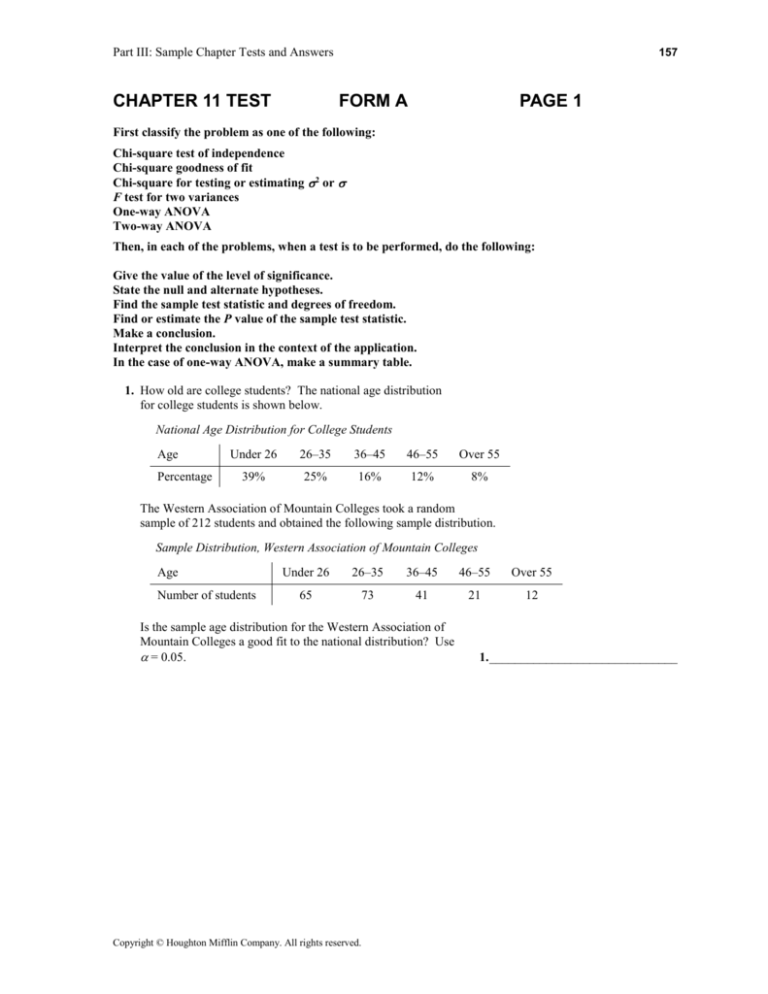
1. How old are college students? The national age distribution
for college students is shown below.
National Age Distribution for College Students
Age
Percentage
Under 26
26–35
36–45
46–55
Over 55
39%
25%
16%
12%
8%
The Western Association of Mountain Colleges took a random
sample of 212 students and obtained the following sample distribution.
Sample Distribution, Western Association of Mountain Colleges
Age
Number of students
Under 26
26–35
36–45
46–55
Over 55
65
73
41
21
12
Is the sample age distribution for the Western Association of
Mountain Colleges a good fit to the national distribution? Use
= 0.05.
Copyright © Houghton Mifflin Company. All rights reserved.
1. ______________________________
Part III: Sample Chapter Tests and Answers
CHAPTER 11 TEST
158
FORM A
PAGE 2
2. Are teacher evaluations independent of grades? Halfway through
the term, a random sample of 284 students were asked to evaluate
teacher performance. The students also were asked to supply their
midterm grade in the course being evaluated. In this study, only
students with a passing grade (A, B, or C) were included in the
summary table.
Midterm Grade
Teacher Evaluation
A
B
C
Row Total
Positive
35
33
28
96
Neutral
25
46
35
106
Negative
20
22
40
82
Column total
80
101
103
284
Use a 5% level of significance to test the claim that teacher evaluations are independent of midterm grades.
3. If we have a normal population with variance 2 and a random
sample of n measurements taken from this population, what
probability distribution do we use to test claims about the
variance?
2. _____________________________
3. _____________________________
4. A technician tested 25 motors for toy electric trains and found the
sample standard deviation of electric current to be s = 4.9 amperes.
(a) Find a 95% confidence interval for , the population standard
deviation of electric current in all such toy trains.
4. (a) __________________________
(b) If the manufacturer specifies that = 4.1 amperes, do the
sample data indicate that is larger than 4.1? Use a 1% level
of significance.
(b) __________________________
5. Two methods of manufacturing large roller bearings are under
study. In this study, the diameters of the bearings are measured.
For Method I, a random sample of n1 = 16 bearings had
sample standard deviation of s1 = 2.9 mm. For Method II, a
random sample of 18 bearings had a sample standard
deviation of s2 = 1.2 mm. Assume that the diameters
follow a normal distribution. Test the claim that 12 22
using a 1% level of significance.
5. _____________________________
Copyright © Houghton Mifflin Company. All rights reserved.
Part III: Sample Chapter Tests and Answers
CHAPTER 11 TEST
159
FORM A
PAGE 3
6. Sasha has decided to buy one of four different cars. She is interested in whether there is a difference in the gas mileage of
the cars. In a study, miles per gallon were obtained for a random sample for each of the four cars. The results of a one-way
ANOVA test are summarized below.
ANOVA for mpg
Source
SS
d.f.
MS
F
P Value
Between groups
65.43
3
21.81
2.42
0.091
Within groups
216.29
24
9.01
Number of students
281.71
27
Use a 5% level of significance to test whether there is a difference among the population means.
6. _____________________________
7. A study to determine if management style affects the number of sick
days taken by employees in a department was conducted. Three
departments with the same number of employees were studied. The
management style used in one department was top-down, with employees
having little input into decisions. In another department, quality-control
experts made recommendations. In the last department, the management
gathered input informally from the employees. The total number of sick
days taken per month by all the employees in the department was
recorded. For a random sample of 3 months, the numbers follow:
Top-down management
19
34
28
Quality teams
16
21
15
Informal input
15
12
14
Use a one-way ANOVA to test if the mean number of sick
days for departments managed in the various styles are
different. Use = 0.05.
Copyright © Houghton Mifflin Company. All rights reserved.
7. _____________________________
Part III: Sample Chapter Tests and Answers
CHAPTER 11 TEST
160
FORM A
PAGE 4
8. Will students perform better if they can choose the section of
a course in which they enroll? Does the class status of the
student make a difference? A researcher is studying this
question. Four blocks of students are formed according to
class status: freshman, sophomore, junior, senior. Each student
must enroll in Spanish I. The researcher selects a random sample
of 10 students from each of the blocks and allows them to enroll
in the section of their choice. Another random sample of 10
students from each block is assigned a section of Spanish I.
At the end of the semester, all students take the same final exam.
The researcher records the scores and compares the scores for all
the students participating in the study.
(a) Draw a flowchart showing the design of this experiment.
8. (a) __________________________
(b) Does the design fit the model for a two-way ANOVA
randomized block design? Explain.
(b) __________________________
9. James drives to work each morning during rush hour. Does
commute time depend on route? Does it depend on time of
departure? In a study, the times (in minutes) were gathered
for random samples. There were four different routes and
three different departure times. The results of a two-way
ANOVA test are summarized below.
ANOVA
Source
SS
d.f.
MS
F
P Value
Route
613.4
3
204.5
5.00
0.008
19.1
2
9.5
0.23
0.796
Interaction
357.2
6
59.5
1.45
0.237
Error
982.7
24
40.9
Total
1972.4
35
Departure time
(a) Test to see if there is any evidence of interaction between
the two factors at a level of significance of 0.01.
(b) If there is no evidence of interaction, test to see if there is a
difference in mean time based on route. Use = 0.01.
9. (a) __________________________
(b) __________________________
(c) If there is no evidence of interaction, test to see if there is a
difference in mean time based on departure time. Use = 0.01. (c) __________________________
Copyright © Houghton Mifflin Company. All rights reserved.
Part III: Sample Chapter Tests and Answers
CHAPTER 11 TEST
161
FORM B
PAGE 1
First, classify the problem as one of the following:
Chi-square test of independence
Chi-square goodness of fit
Chi-square for testing or estimating 2 or
F test for two variances
One-way ANOVA
Two-way ANOVA
Then, in each of the problems, when a test is to be performed, do the following:
Give the value of the level of significance.
State the null and alternate hypotheses.
Find the sample test statistic and degrees of freedom.
Find or estimate the P value of the sample test statistic.
Make a conclusion.
Interpret the conclusion in the context of the application.
In the case of one-way ANOVA, make a summary table.
1. The Fish and Game Department in Wisconsin stocked a new lake
with the following distribution of game fish.
Initial Stocking Distribution
Fish
Pike
Trout
Perch
Bass
Bluegill
Percent
10%
15%
20%
25%
30%
After 6 years, a random sample of 197 fish from the lake was
netted, identified, and released. The sample distribution is shown
next.
Sample Distribution after Six Years
Fish
Number
Pike
Trout
Perch
Bass
Bluegill
35
17
33
55
57
Is the sample distribution of fish in the lake after 6 years a good
fit to the initial stocking distribution? Use a 5% level of significance.
Copyright © Houghton Mifflin Company. All rights reserved.
1. ______________________________
Part III: Sample Chapter Tests and Answers
CHAPTER 11 TEST
162
FORM B
PAGE 2
2. Is the choice of college major independent of grade average?
A random sample of 445 students was surveyed by the registrar’s office regarding major field of study and grade average.
In this study, only students with passing grades (A, B, or C)
were included in the survey. Grade averages were rounded to
the nearest letter grade (e.g., 3.6 grade point average was rounded
to 4.0, or A).
Grade Average
Major
A
B
C
Row Total
Science
38
49
63
150
Business
41
42
59
142
Humanities
32
53
68
153
Column total
111
144
190
445
Use a 1% level of significance to test the claim that choice of
major field is independent of grade average.
2. _____________________________
3. If we have two normal populations with equal variances, and random samples n1 and n2 are taken from these populations, what
probability distribution do we use to test claims about the
variances?
3. _____________________________
4. An automobile service station times its quick lube service for a
random sample of 22 customers. The sample standard deviation of
time was s = 7.2 minutes.
(a) Find a 90% confidence interval for , the population standard
deviation of quick lube times.
4. (a) __________________________
(b) The service manager specifies that be 6.0 minutes. Do the
sample data indicate that is different from 6.0? Use a 1% level
of significance.
(b) __________________________
5. A large national chain of department stores has two basic inventories.
Variation of cash flow for the two types of inventories is under study.
A random sample of n1 = 9 stores with Inventory I had sample standard
deviation of daily cash flow s1 = $3,115. Another random sample of
n2 = 11 stores with Inventory II had sample standard deviation of daily
cash flow s2 = $2,719. Assume that daily cash flow follows a normal distribution. Test the claim that the population variances of the two inventories
are different. Use a 5% level of significance.
5. _____________________________
Copyright © Houghton Mifflin Company. All rights reserved.
Part III: Sample Chapter Tests and Answers
CHAPTER 11 TEST
163
FORM B
PAGE 3
6. Elizabeth watches the sodium content of foods because she has
high blood pressure. The sodium content was measured for
random samples from each of four different brands of tuna. The
results of a one-way ANOVA test are summarized below.
ANOVA for Sodium Content
Source
SS
d.f.
MS
F
P Value
Between groups
11,786
3
3929
4.37
0.016
Within groups
17,979
20
899
Total
29,766
23
Use a 5% level of significance to test whether there is a difference among the population means.
6. _____________________________
7. A study of depression and exercise was conducted. Three groups
were used: a designed exercise program, a sedentary group, and
a group of runners. A depression rating (higher scores, meaning more
depression) was given to the participants in each group. Small
random samples from each group provided the following data on the
depression rating.
Treatment group
63
58
61
Sedentary group
71
64
68
Runners
49
52
47
Use a one-way ANOVA to test if the mean depression ratings
for the three groups are different. Use = 0.05.
7. _____________________________
8. A study was conducted to measure sales volume of a grocery
store item. The study looked at sales volume for the product
placed in three different shelf locations: eye level, low, special
display. In addition, the study looked at sales volume for the
item when it was advertised in two different ways: on TV or
with newspaper coupons. A two-way ANOVA test was used
to determine if there was any difference in mean sales volume
according to shelf location or advertising method.
(a) List the factors and the levels of each factor for this study.
(b) Explain what it means to have interaction between the
factors. State the null and the alternate hypotheses used
to test for interaction.
Copyright © Houghton Mifflin Company. All rights reserved.
8. (a) __________________________
(b) __________________________
Part III: Sample Chapter Tests and Answers
CHAPTER 11 TEST
164
FORM B
PAGE 4
9. A travel agent reserves flights primarily with four major airlines. The agent would like to know if the price depends on
the airline or if the price depends on the destination. In a study,
the prices were gathered for random samples. There were four
airlines and four destinations. The results of a two-way ANOVA
test are summarized below.
ANOVA
Source
SS
d.f.
MS
F
P Value
Airline
19,080
3
6,360
0.66
0.585
Destination
326,793
2
163,397
17.05
0.000
Interaction
49,168
6
8,195
0.85
0.545
Error
230,050
24
9,585
Total
625,091
35
(a) Test to see if there is any evidence of interaction between
the two factors at a level of significance of 0.05.
9. (a) __________________________
(b) If there is no evidence of interaction, test to see if there is
a difference in mean price based on airline. Use = 0.05.
(b) __________________________
(c) If there is no evidence of interaction, test to see if there is
a difference in mean price based on destination. Use = 0.05.
(c) __________________________
Copyright © Houghton Mifflin Company. All rights reserved.
Part III: Sample Chapter Tests and Answers
CHAPTER 11 TEST
165
FORM C
PAGE 1
Write the letter of the response that best answers each problem.
1. A market research study was conducted to compare three different brands of
antiperspirant. The results of the study are summarized below. Use a 5%
level of significant to test the claim that opinion is independent of brand.
Brand
Opinion
A
B
C
Total
Excellent
29
37
50
116
Satisfactory
83
65
83
231
Unsatisfactory
18
9
6
33
Total
130
111
139
380
A. State the null and alternate hypotheses.
1. A. __________
(a) H0: Opinion and brand are dependent; H1: Opinion and brand are independent.
(b) H0: A = B = C ; H1: Not all 1, 2, 3 are equal.
(c) H0: Opinion and brand are independent; H1: Opinion and brand are not independent.
(d) H0: 12 22 ; H1: 1 = 2.
(e) H0: The distributions are normal; H1: The distributions are not normal.
B. What is the value of the sample test statistic?
(a) 2 = 19.00
(b) 2 = 9.49
(c) d.f. = 4
(d) F = 0.10
B. __________
(e) 2 = 11.9
C. What is the P value of the sample test statistic?
C. __________
(a) 0.100 < P value < 0.900
(b) 0.005 < P value < 0.010
(c) P value < 0.005
(d) 0.010 < P value < 0.025
(e) 0.025 < P value < 0.050
D. What is your conclusion?
(a) Reject H0.
(b) Do not reject H0.
Copyright © Houghton Mifflin Company. All rights reserved.
D. __________
(c) Cannot determine.
Part III: Sample Chapter Tests and Answers
CHAPTER 11 TEST
166
FORM C
PAGE 2
2. How much do second graders weigh? A county hospital found the weight distribution
shown below.
Hospital Weight Distribution
Weight (lb)
Under 45
45–59
60–74
75–89
Over 89
7%
21%
41%
19%
12%
Percent
An elementary school within the county took a random sample of 125 second graders
and obtained the following sample distribution.
Sample Distribution, Elementary School
Weight (lb)
Under 45
45–59
60–74
75–89
Over 89
6
29
50
30
10
Number of second graders
Is the sample weight distribution for the elementary school a good fit to the hospital
distribution? Use = 0.05.
A. State the null and alternate hypotheses.
2. A. __________
(a) H0: 1 = 2 = 3 = 4 = 5; H1: Not all 1, 2, 3, are equal.
(b) H0: Weight and percent are independent; H1: Weight and percent are dependent.
(c) H0: 12 22 ; H1: 1 = 2.
(d) H0: The distributions are the same; H1: The distributions are different.
(e) H0: The distributions are the same; H1: The distribution for elementary school is higher.
B. What is the value of the sample test statistic?
(a) 2 = 11.07
(b) 2 = 5.35
(c) 2 = 4.49
(d) t = 7.27
B. __________
(e) 2 = 9.49
C. What is the P value of the sample test statistic?
C. __________
(a) 0.100 < P value < 0.900
(b) 0.050 < P value < 0.100
(c) P value > 0.900
(d) 0.0050 < P value < 0.010
(e) P value < 0.005
D. What is your conclusion?
(a) Reject H0.
(b) Do not reject H0.
D. __________
(c) Cannot determine.
Copyright © Houghton Mifflin Company. All rights reserved.
Part III: Sample Chapter Tests and Answers
CHAPTER 11 TEST
167
FORM C
PAGE 3
3. Find the P value for each situation.
A. Test statistic 2 30 for a right-tailed test. d.f. = 18.
(a) P value < 0.01
(b) P value > 0.05
(c) 0.01 < P value < 0.025
(d) P value = 0.05
3. A. __________
(e) 0.025 < P value < 0.05
B. Test statistic 2 3.5 for a left-tailed test. d.f. = 15.
(a) 0.005 < P value < 0.010
(b) P value > 0.05
(c) P value < 0.005
(d) P value = 0.01
B. __________
(e) 0.025 < P value < 0.05
C. Test statistic 2 25 for a right-tailed test. d.f. = 20.
(a) P value < 0.100
(b) P value < 0.001
(c) 0.05 < P value < 0.10
(d) P value > 0.100
C. __________
(e) 0.025 < P value < 0.05
4. A salesperson tested 30 sport utility vehicles for gas mileage (in miles per gallon)
and found the sample standard deviation to be s = 4.7 mpg.
A. Find a 95% confidence interval for 2, the population variance of mileage for all
such sport utility vehicles.
(a) 14.01 < 2 < 39.91
(b) 15.05 < 2 < 36.17
(c) 2.98 < 2 < 8.49
(d) 14.49 < 2 < 41.29
4. A. __________
(e) 13.64 < 2 < 36.65
B. If the manufacturer specifies that = 4.0 mpg, do the sample data indicate
that is larger than 4.0? Use = 0.01, and find the value of the sample
test statistic and the P value.
(a) 2 = 49.59, 0.005 < P value < 0.010
(b) 2 = 40.04, 0.100 < P value < 0.200
(c) 2 = 41.42, 0.050 < P value < 0.100
(d) 2 = 41.42, 0.005 < P value < 0.010
(e) 2 = 40.04, 0.050 < P value < 0.100
Copyright © Houghton Mifflin Company. All rights reserved.
B. __________
Part III: Sample Chapter Tests and Answers
CHAPTER 11 TEST
168
FORM C
PAGE 4
C. What is your conclusion for the test in Part B?
C. __________
(a) There is sufficient evidence to conclude that the standard deviation is larger than 4.0 mpg.
(b) There is insufficient evidence to conclude that the standard deviation is larger than 4.0 mpg.
5. Two printing machines are under study. For Machine I, a random sample of
n1 = 10 newspapers had a sample standard deviation of time s1 = 1.4 minute.
For Machine II, a random sample of n2 = 12 newspapers had a sample standard
deviation of s2 = 0.8 minutes. Assume that the times follow a normal distribution.
Test the claim that 12 22 using a 1% level of significance.
A. State the null and alternate hypotheses.
5. A. ___________
(a) H0: 12 22 ; H1: 12 22
(b) H0: 12 0; H1: 22 0
(c) H0: 12 22 ; H1: 12 22
(d) H0: 12 22 ; H1: 12 22
(e) H0: 12 22 ; H1: 12 22
B. What is the value of the sample test statistic?
(a) F = 0.33
(b) F = 1.75
(c) F = 3.06
(d) t = 3.06
B. __________
(e) F = 0.57
C. What is the P value?
C. __________
(a) 0.001 < P value < 0.010
(b) 0.025 < P value < 0.050
(c) P value > 0.100
(d) P value < 0.100
(e) P value < 0.001
D. What is your conclusion?
(a) Reject H0.
(b) Do not reject H0.
D. __________
(c) Cannot determine.
Copyright © Houghton Mifflin Company. All rights reserved.
Part III: Sample Chapter Tests and Answers
CHAPTER 11 TEST
169
FORM C
PAGE 5
6. Do cough medicines differ in the length of time of relief? The relief time was
recorded for random samples of volunteers for each of four different brands of
cough medicine. The results of ANOVA test are summarized below.
ANOVA
Source
SS
d.f.
MS
F
P Value
Between groups
6.17
3
2.056
2.11
0.122
Within groups
27.26
28
0.974
Total
33.43
31
Use a 5% level of significance to test whether there is a difference among the population means.
A. What are the null and alternate hypotheses?
6. A. __________
(a) H0: 1 = 2 = 3 = 4; H1: Not all of the means are equal.
(b) H0: 1 = 2 = 3 = 4; H1: 1 > 2 > 3 > 4.
(c) H0: 1 = 2 = 3; H1: Not all of the means are equal.
(d) H0: 12 22 32 42 ; H1: 12 22 32 42 .
(e) H0: 1 2 3 4; H1: 1 = 2 = 3 = 4.
B. What is the value of the sample test statistic?
(a) F = 6.85
(b) F = 2.056
(c) F = 0.974
(d) F = 0.122
B. __________
(e) F = 2.11
C. What is the P value?
C. __________
(a) 0.974
(b) 2.95
(c) 2.056
(d) 0.122
(e) 2.11
D. What is your conclusion?
(a) Reject H0.
(b) Do not reject H0.
Copyright © Houghton Mifflin Company. All rights reserved.
D. __________
(c) Cannot determine.
Part III: Sample Chapter Tests and Answers
CHAPTER 11 TEST
170
FORM C
PAGE 6
7. An ornithologist is studying the length (in seconds) of bird calls. Random samples
from three different breeds yielded the following results.
Breed 1
2.3
1.9
2.1
Breed 2
0.8
1.2
1.1
Breed 3
2.0
1.4
1.7
Use one-way ANOVA to test if the mean call length differs for the three breeds. Use
= 0.05.
A. What are the null and alternate hypotheses?
7. A. __________
(a) H0: 1 2 3; H1: 1 = 2 = 3.
(b) H0: 12 22 32 ; H1: 12 22 32 .
(c) H0: 1 = 2 = 3; H1: Not all of 1, 2, 3 are equal.
(d) H0: 1 2 3; H1: 1 > 2 > 3.
(e) H0: The distributions are the same; H1: The distributions are not the same.
B. What is the value of the sample test statistic?
(a) F = 0.005
(b) F = 19.33
(c) 2 = 15.08
(d) F = 15.08
B. __________
(e) F = 5.14
C. What is the P value?
C. __________
(a) 0.871
(b) 0.05
(c) 0.010
(d) 0.005
(e) 15.08
D. What is your conclusion?
(a) Reject H0.
(b) Do not reject H0.
D. __________
(c) Cannot determine.
Copyright © Houghton Mifflin Company. All rights reserved.
Part III: Sample Chapter Tests and Answers
CHAPTER 11 TEST
171
FORM C
PAGE 7
8. When performing a two-way ANOVA test, which of the following is not a required
assumption?
8. __________
(a) There are the same number of measurements in each cell.
(b) The measurements in each cell of a two-way ANOVA model are assumed
to come from distributions with approximately the same variance.
(c) There are the same number of levels for each factor.
(d) The measurements in each cell come from independent random samples.
(e) The measurements in each cell of a two-way ANOVA model are assumed
to be drawn from a population with a normal distribution.
9. Are differences in test scores due to schools or are they due to exam forms?
Three different, although supposedly equivalent, forms of a standardized
achievement exam were given to a random sample of students in each of
four different schools. Their scores were recorded. The results of a two-way
ANOVA test are summarized below.
ANOVA
Source
SS
d.f.
MS
F
P Value
3,532
2
1,766
8.61
0.002
School
749
3
250
1.22
0.324
Interaction
768
6
128
0.62
0.712
Error
4,917
24
205
Total
9,965
35
Exam form
A. When conducting a test to see if there is evidence of interaction between the
factors, what are the values of the test statistic and the P value?
(a) F = 8.61; P value = 0.002
(b) F = 1.22; P value = 0.324
(c) F = 0.62; P value = 0.712
(d) F = 128; P value = 0.05
9. A. __________
(e) F = 8.62; P value = 0.002
B. What is your conclusion from the test in part A? Use = 0.05.
(a) Do not reject H0; there is evidence of interaction.
(b) Do not reject H0; there is no evidence of interaction.
(c) Reject H0; there is evidence of interaction.
(d) Reject H0; there is no evidence of interaction.
(e) Cannot determine.
Copyright © Houghton Mifflin Company. All rights reserved.
B. __________
Part III: Sample Chapter Tests and Answers
CHAPTER 11 TEST
172
FORM C
PAGE 8
C. Assume that there is no evidence of interaction between the factors. When
conducting a test to see if there is a difference in mean scores based on an
exam form, what are the critical F value and the value of the test statistic?
(a) F = 8.61, P value = 0.002
(b) F = 1.22; P value = 0.324
(c) F = 0.62; P value = 0.712
(d) F = 3.40; P value = 0.002
C. __________
(e) F = 8.61; P value = 0.712
D. Assume that there is no evidence of interaction between the factors. When
conducting a test to see if there is a difference in mean scores based on
school, what are the value of the test statistic and the P value?
(a) F = 8.62; P value = 0.002
(b) F = 0.62; P value = 0.712
(c) F = 1.22; P value = 0.002
(d) F = 1.22; P value = 0.324
D. __________
(e) F = 3.01; P value = 0.05
E. What are your conclusions from the tests in parts C and D? Use = 0.05.
E. __________
(a) Cannot determine.
(b) Do not reject H0 from C; do not reject H0 from D.
(c) Do not reject H0 from C; reject H0 from D.
(d) Reject H0 from C; reject H0 from D.
(e) Reject H0 from C; do not reject H0 from D.
Copyright © Houghton Mifflin Company. All rights reserved.

