Assignment 10(word file with instructions and questions)
advertisement
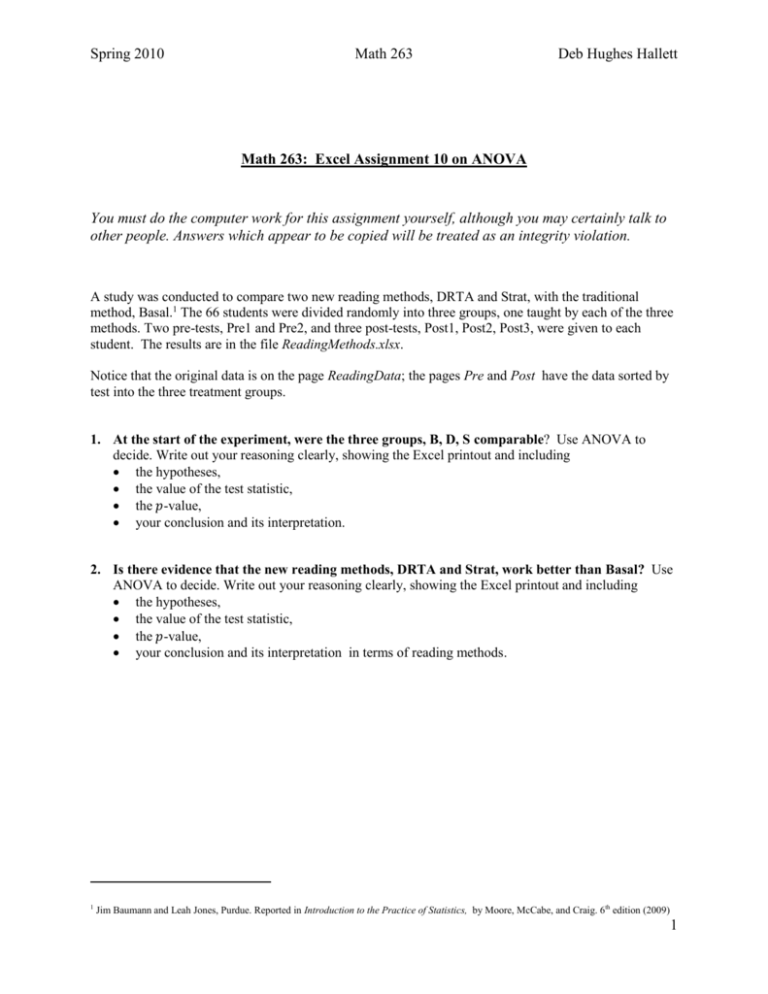
Spring 2010 Math 263 Deb Hughes Hallett Math 263: Excel Assignment 10 on ANOVA You must do the computer work for this assignment yourself, although you may certainly talk to other people. Answers which appear to be copied will be treated as an integrity violation. A study was conducted to compare two new reading methods, DRTA and Strat, with the traditional method, Basal.1 The 66 students were divided randomly into three groups, one taught by each of the three methods. Two pre-tests, Pre1 and Pre2, and three post-tests, Post1, Post2, Post3, were given to each student. The results are in the file ReadingMethods.xlsx. Notice that the original data is on the page ReadingData; the pages Pre and Post have the data sorted by test into the three treatment groups. 1. At the start of the experiment, were the three groups, B, D, S comparable? Use ANOVA to decide. Write out your reasoning clearly, showing the Excel printout and including the hypotheses, the value of the test statistic, the 𝑝-value, your conclusion and its interpretation. 2. Is there evidence that the new reading methods, DRTA and Strat, work better than Basal? Use ANOVA to decide. Write out your reasoning clearly, showing the Excel printout and including the hypotheses, the value of the test statistic, the 𝑝-value, your conclusion and its interpretation in terms of reading methods. 1 Jim Baumann and Leah Jones, Purdue. Reported in Introduction to the Practice of Statistics, by Moore, McCabe, and Craig. 6th edition (2009) 1 Spring 2010 Math 263 Deb Hughes Hallett ANOVA on Excel To do ANOVA on a Windows machine, you will need the Data Analysis Tool-Pak installed, as you did for the histograms. To use this: 1. Sort the data. Each sample should be in its own row or column, with labels at the top or to the left. The samples must all be next to each other. 2. Open the Date Analysis Too-Pak and select ANOVA one factor. 3. Fill in the dialog box that comes up. 2

