Solubility of KNO3 Lab Report Format
advertisement
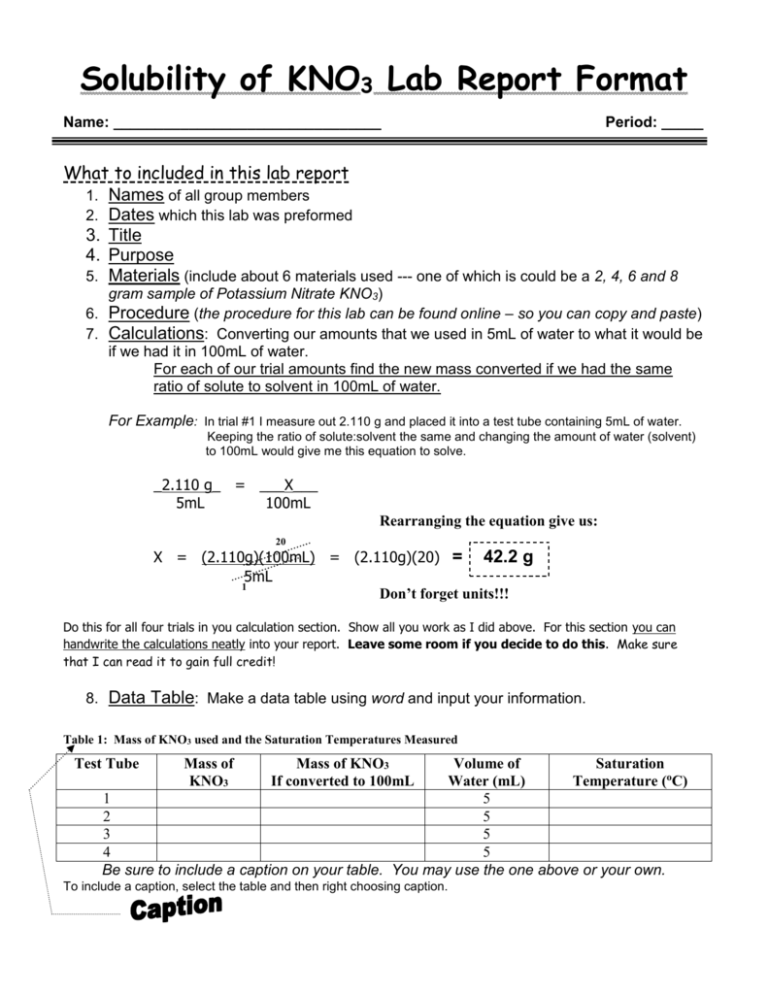
Solubility of KNO3 Lab Report Format Name: ________________________________ Period: _____ What to included in this lab report 1. Names of all group members 2. Dates which this lab was preformed 3. Title 4. Purpose 5. Materials (include about 6 materials used --- one of which is could be a 2, 4, 6 and 8 gram sample of Potassium Nitrate KNO3) 6. Procedure (the procedure for this lab can be found online – so you can copy and paste) 7. Calculations: Converting our amounts that we used in 5mL of water to what it would be if we had it in 100mL of water. For each of our trial amounts find the new mass converted if we had the same ratio of solute to solvent in 100mL of water. For Example: In trial #1 I measure out 2.110 g and placed it into a test tube containing 5mL of water. Keeping the ratio of solute:solvent the same and changing the amount of water (solvent) to 100mL would give me this equation to solve. _2.110 g_ = ___X___ 5mL 100mL Rearranging the equation give us: 20 X = (2.110g)(100mL) = (2.110g)(20) = 42.2 g 5mL 1 Don’t forget units!!! Do this for all four trials in you calculation section. Show all you work as I did above. For this section you can handwrite the calculations neatly into your report. Leave some room if you decide to do this. Make sure that I can read it to gain full credit! 8. Data Table: Make a data table using word and input your information. Table 1: Mass of KNO3 used and the Saturation Temperatures Measured Test Tube Mass of KNO3 Mass of KNO3 If converted to 100mL Volume of Saturation Water (mL) Temperature (oC) 1 5 2 5 3 5 4 5 Be sure to include a caption on your table. You may use the one above or your own. To include a caption, select the table and then right choosing caption. 9. Graphs: In this lab you will have two graphs: The first graph will consist of only 4 points corresponding to your four trials. It is from this graph that you will plot a trendline displaying the equation and R2 value of each line. Choose the equation that has the closest R2 value to 1 as the equation to use in the second graph. You can name graph #1: Solubility of KNO3 from 4 trials The second graph will consist of extrapolated data. That is data that would be there theoretically if more trials were preformed. You will get these point by arbitrarily plotting values of x using the equation of the line from graph #1 to calculate the y values. Include the equation you used to construct the graph by inserting a textbox. You can name graph #2: Solubility Curve of KNO3 from experimental data Make sure that you label each axis of your graph. The x axis should be Temperature (0C) The y axis should be Grams of KNO3 per 100mL of Water You can copy and paste your graph into your lab report. Here is how you do that: 1. Select the Chart option (not spreadsheet) when constructing the graph. 2. Click outside the graph so that the sizing boxes appear. 3. Click copy 4. Choose the location in your lab report where the graph should appear and click paste. 5. You will have to resize your chart using the sizing boxes to an appropriate size. Be sure you can read all axis. 6. Right click on your graph when in Word and choose caption: 7. Type the names of each graph in the caption. 10. Questions: (Use graph #2 to answer the following questions) a. Using your graph, what is the solubility of KNO 3 at 300C? (1point) b. Using your graph, what is the solubility of KNO 3 at 500C? (1 point) c. Using your graph, what is the solubility of KNO3 at 700C? (1 point) d. Based on your solubility curve would the following solutions be saturated, unsaturated, or supersaturated? i. 40g/100mL of H2O at 45oC (1 point) ii. 80g/100mL of H2O at 70oC (1 point) iii. 90g/100mL of H2O at 30oC (1 point) e. Calculate the concentration of: (2 points each) i. test tube #1 ii. test tube #2 iii. test tube #3 iv. test tube #4 v. test tube #5 How you will be graded Names included: ----------------------------------------------------------------- 1 point Title: ----------------------------------------------------------------------------- 1 point Purpose: -------------------------------------------------------------------------- 1 point Materials:------------------------------------------------------------------------- 1 point Calculations showing all work for the 4 trials ---------------------------------- 4 points Data Table with caption --------------------------------------------------------- 1 points Graphs with appropriate titles, axis and equations ----------------------------10 points Questions (4 question a-d above answered using your second graph) -------- 16 points
