What Is Server Analysis and Optimization?
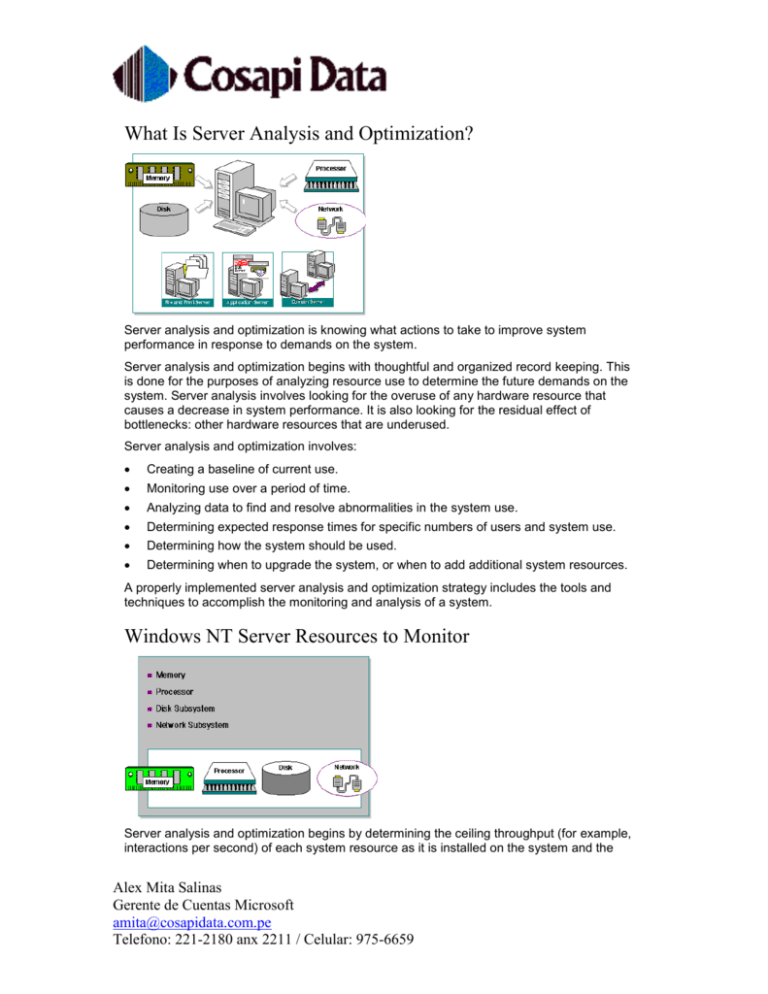
Server analysis and optimization is knowing what actions to take to improve system
performance in response to demands on the system.
Server analysis and optimization begins with thoughtful and organized record keeping. This
is done for the purposes of analyzing resource use to determine the future demands on the
system. Server analysis involves looking for the overuse of any hardware resource that
causes a decrease in system performance. It is also looking for the residual effect of
bottlenecks: other hardware resources that are underused.
Server analysis and optimization involves:
Creating a baseline of current use.
Monitoring use over a period of time.
Analyzing data to find and resolve abnormalities in the system use.
Determining expected response times for specific numbers of users and system use.
Determining how the system should be used.
Determining when to upgrade the system, or when to add additional system resources.
A properly implemented server analysis and optimization strategy includes the tools and
techniques to accomplish the monitoring and analysis of a system.
Windows NT Server Resources to Monitor
Server analysis and optimization begins by determining the ceiling throughput (for example,
interactions per second) of each system resource as it is installed on the system and the
Alex Mita Salinas
Gerente de Cuentas Microsoft
amita@cosapidata.com.pe
Telefono: 221-2180 anx 2211 / Celular: 975-6659
network. Determining the throughput during installation establishes the allowable throughput
for each resource as it is used.
A number of system resources need to be monitored when implementing a server analysis
and optimization strategy. The following resources often have the most impact on server
performance:
Memory
Processor
Disk subsystem
Network subsystem
When monitoring system resources, it is important to monitor not only each resource
individually, but also the system as a whole. By monitoring the entire system, it is easier to
detect problems that are a result of resource combinations. The use of one system resource
can affect the performance of another, thus masking the usage and performance of the
second resource. For example, when the disk subsystem is extremely busy, it is very
common for it to fail to perform to the expected level. This failure to perform may result from
a system that does not have enough RAM. The lack of adequate RAM may then result in
excess paging, which lowers the disk subsystem throughput in response to system and user
requests. Monitoring all four system resources provides a much clearer look at the effects
that resource combinations have on each other.
Memory
Consider two main types of memory when you analyze server performance: random-access
memory (RAM), and cache. Simply put, the more of each, the better.
Also, consider other factors, such as the size and location of the paging file. For example, it
is generally recommended to move the paging file from the system partition to another
position for performance. However, this eliminates the Crashdump utility.
Processor
Alex Mita Salinas
Gerente de Cuentas Microsoft
amita@cosapidata.com.pe
Telefono: 221-2180 anx 2211 / Celular: 975-6659
The type of system processor, as well as the number of processors, affects the overall
performance of the system. For example, a Digital Alpha XP processor can provide better
performance than an Intel 80486.
Windows NT Server supports symmetric multiprocessing so that if a system has multiple
applications running concurrently, or applications that are multithreaded, the overall
processor power is shared.
Disk Subsystem
Several factors affect disk subsystem performance, and each of these factors should be
taken into consideration during analysis and optimization.
Type and Number of Controllers
The controller type and the number of controllers affect the overall system responsiveness
when responding to information requests being read from or written to disk drives. Installing
multiple disk controllers can result in higher throughput. Note the throughput of the following
controllers:
IDE controllers have a throughput of about 2.5 MB per second.
Standard SCSI controllers have a throughput of about 3 MB per second.
SCSI-2 controllers have a throughput of about 5 MB per second.
Fast SCSI-2 controllers have a throughput of about 10 MB per second.
PCI controller cards can transfer data at up to 40 MB per second.
Busmaster Controllers
Alex Mita Salinas
Gerente de Cuentas Microsoft
amita@cosapidata.com.pe
Telefono: 221-2180 anx 2211 / Celular: 975-6659
Busmaster controllers have an on-board processor that handles all interrupts until data is
ready to be passed to the CPU for processing. This helps the processor to avoid
interruptions for data.
Caching
Caching helps improve disk responsiveness as data is cached on the controller and does not
require RAM or internal cache.
Controllers That Support RAID
Controllers that support hardware-level RAID (Redundant Array of Inexpensive Disks) can
offer better performance than software implemented RAID. By implementing striping or
striping with parity, disk performance may be improved. In one test, for example, writing a
200MB file to a stripe set (without parity) was 20 percent faster than writing to a single hard
disk drive in the same system. The same result may not occur in all tests, so each system
needs to be analyzed independently.
The Type of Work Being Performed
If the applications are disk-bound (many read and write requests), implementing the fastest
disk subsystem provides the best performance.
For single processor systems, implementing a Fast SCSI-2 as the minimum controller base
is generally recommended.
The Type of Drives Implemented
Disk performance is generally measured in disk access time. It is not uncommon to find hard
disk drives with access speed in the low teens or lower.
Implement drives that complement the rest of the architecture, such as the controller.
Choose a manufacturer that supplies the fastest drive available in each of its systems.
Network Subsystem
Overall network performance and capacity may be affected by a number of factors. Consider
each factor in its unique environment to determine whether or not it has an impact on
network capacity and server performance.
Network Adapter Type
Alex Mita Salinas
Gerente de Cuentas Microsoft
amita@cosapidata.com.pe
Telefono: 221-2180 anx 2211 / Celular: 975-6659
Implement a high bandwidth card (such as a 32-bit bus mastering card), trying to avoid
programmed input/output (PIO) adapters, as they use the CPU to move data from the
network adapter to RAM. Note the example transfer speeds of the following adapters:
8-bit network adapters transfer up to 400 kilobytes per second (KBps).
16-bit adapters transfer up to 800 KBps.
32-bit adapters transfer up to 1.2 megabytes per second (MBps).
Multiple Network Adapters
Installing multiple network adapters is beneficial in a server environment because doing so
allows the server to process network requests over multiple adapters simultaneously. If your
network uses multiple protocols, consider placing each protocol on a different adapter. It is
common to have all server-based traffic on a single adapter, for example, while performing
host access using SNA on a different adapter.
Number of Users
Consider not only the number of users concurrently accessing a server, but also the number
of inactive connections, because monitoring each connection requires processing time on
the server.
Routers, Bridges, and Other Physical Network Components
Routers, bridges, and other physical network components affect performance of the network,
as do data communications facilities.
Protocols in Use
Most protocols give similar performance, so consider the amount of traffic generated to
perform a given function. Reducing the number of protocols installed can increase
performance.
Additional Network Services in Use
Each service adds memory and processor overhead on the system. These services may
include the following:
Services for Macintosh
RAS
DHCP
WINS
Applications in Use
Each application adds memory and processor overhead on the system. These applications
may include the following:
Internet Services
Messaging applications
Microsoft® SQL Server™
Microsoft Systems Management Server
Alex Mita Salinas
Gerente de Cuentas Microsoft
amita@cosapidata.com.pe
Telefono: 221-2180 anx 2211 / Celular: 975-6659
Microsoft SNA Server
Directory Services (Domain Model and Structure)
The following may affect network capacity and performance:
Number of users—Consider not only the number of users and objects in the domain, but
the number of simultaneous logon requests validated by the domain controller or
controllers.
Number of Backup Domain Controllers (BDCs)—The more domain controllers in a
domain, the more domain account synchronization traffic is generated to assure all
controllers are synchronized.
Proximity of BDCs to Primary Domain Controller (PDC) using WAN links—Domain
account synchronization can use a large percentage of WAN bandwidth. Consider
changing the ReplicationGovernor parameter to “schedule” the amount of bandwidth
that the account synchronization process uses.
Performance Monitor Options
Performance Monitor allows:
Viewing data from multiple computers simultaneously.
Seeing how changes that are made affect the computer.
Changing charts of current activity while viewing them.
Exporting Performance Monitor data to spreadsheets or database programs, or using it
as raw input for Microsoft Visual Basic® and C programs.
Triggering a program or procedure, or sending notices when a threshold is exceeded.
Logging data about various objects from different computers over time. These log files
are used to record typical resource use, monitor a problem, or help in capacity planning.
Combining selected sections of several log files into a long-term archive.
Reporting on current activity or trends over time.
Saving different combinations of counter and option settings for quick starts and
changes.
Note Computer initialization startup activities and network traffic can interfere with testing.
Wait until the computer settles before testing. Also, disconnect the computer from the
network if network activity is not being tested. Network drivers may respond to network
events even if they are not directed to the testing computer.
Alex Mita Salinas
Gerente de Cuentas Microsoft
amita@cosapidata.com.pe
Telefono: 221-2180 anx 2211 / Celular: 975-6659
Objects in Performance Monitor
Performance Monitor measures the behavior of computer objects. The objects represent
threads and processes, sections of shared memory, and physical devices. Performance
Monitor collects data on activity, demand, and space used by the objects. Some objects,
known as core objects, always appear in Performance Monitor; others appear only if the
service or process is installing.
Windows NT Performance Monitor Core Objects
Object name
Description
Cache An area of physical memory that holds recently used data.
LogicalDisk
Disk partitions and other logical views of disk space.
Memory
Random-access memory used to store code and data.
Objects Certain system software objects.
Paging File
File used to back up virtual memory allocations.
PhysicalDisk Hardware disk unit (spindle or RAID device).
Process
Software object that represents a running program.
Processor
Hardware unit that executes program instructions.
Redirector
File system that diverts file requests to network servers.
System Counters that apply to all system hardware and software.
Thread The part of a process that uses the processor.
Some objects have multiple instances. Each instance of an object represents a component
of the system. For example, a computer can have multiple disk drives. Each disk drive is an
instance of the Physical Disk (computer) object.
When the computer being monitored has more than one component of the same object type,
Performance Monitor displays multiple instances of the object in the Instance box of the
Add to Chart (or to View, Log, or Report) dialog box. When appropriate, it also displays the
_Total instance, which represents a sum of the values for all instances of the object. For
example, if a computer has multiple physical disks, there are multiple instances of the
PhysicalDisk object in the Add to Chart dialog box. The _Total would be an accumulation of
all the individual instances.
Some objects are parts of other objects or are dependent upon other objects. The instances
of these related objects are shown in the Instances box in the following format:
Parent object = => Child object
where the child object is part of or is dependent upon the parent object. This makes it easier
to identify the object.
Alex Mita Salinas
Gerente de Cuentas Microsoft
amita@cosapidata.com.pe
Telefono: 221-2180 anx 2211 / Celular: 975-6659
Performance Monitor was designed to cause minimal impact on the operating system. Be
aware, however, that setting high sample rates can have a negative impact on the
performance of the computer.
Select object counters to customize each of the four Performance Monitor views: Chart, Log,
Report and Alert. These counter and option settings can be saved to a file and then different
settings files for all monitoring tasks can be designed.
Note Only active instances appear in the Instances box. A process must be started before
it is seen in Performance Monitor. If logged data is being charted, only processes that were
active when logging began appear in the Instances box.
Counters in Performance Monitor
Performance Monitor can collect, average, and display data from internal counters by using
the Windows NT registry and the Performance Library DLLs. A counter defines the type of
data that is available for a particular type of object.
Performance Monitor collects data on various aspects of hardware and software
performance, such as use, demand, and available space. A Performance Monitor counter is
activated by adding it to a chart or report or by adding an object to a log.
As identified on the previous page, there are objects for physical components such as
Processors, Physical Disks, and Memory, and there are other objects, such as Process and
Paging files. Each object has a set of counters defined for it. Counters in an object record the
activity level of the object. Windows NT Server uses the following typographical convention
to name a counter of a particular object:
object: counter
For example, the % Processor Time counter of the Process object would appear as:
Process: % Processor Time
to distinguish it from Processor: % Processor Time or Thread: % Processor Time.
Note When a counter is selected in any view, Performance Monitor collects data for all
counters of that object, but displays only the counter selected. This creates minimal
overhead, because most overhead in Performance Monitor results from what is displayed on
the screen or written to the harddisk.
There are three types of counters:
Instantaneous counters display the most recent measurement.
For example, Process: Thread Count displays the number of threads found in the most
recent measurement.
Alex Mita Salinas
Gerente de Cuentas Microsoft
amita@cosapidata.com.pe
Telefono: 221-2180 anx 2211 / Celular: 975-6659
Averaging counters measure a value over time and display the average of the last two
measurements. When these counters are started, there is a delay for the second
measurement to be taken before any values are displayed.
For example, Memory: Pages/sec, shows the average number of memory pages found
in the last two reads.
Difference counters subtract the last measurement from the previous one and display
the difference if it is positive. If it is negative, they display a zero.
Performance Monitor does not include any difference counters in its basic set, but they
may be included in other applications that use Performance Monitor, and they can also
be written. For information about writing performance counters, see the Win32®
Software Development Kit.
Some hardware and applications designed for Windows NT come with their own counters.
Many of these extensible counters are installed automatically with the product, but some are
installed separately. In addition, there are a few specialized counters on the Windows NT
Resource Kit 4.0 compact disc that can be installed. See the product documentation and
Performance Monitor Help for detailed instructions on adding extensible counters.
Tip Click the Explain button in the Add To dialog box to display the definition for each
counter. The Explain button works only when current activity is monitored, not logs.
Performance Monitor Views
There are four ways to view data using Performance Monitor: chart, log, report, and alert.
The four views operate independently and concurrently, but only one can be viewed at a
time. Each view gets data independently from the target computers, so looking at a counter
in all four views requires four times the overhead as looking at the same counter in just one
view. Luckily, this overhead is small, so concurrent use of views is not a problem. Use the
View menu to specify a view in Performance Monitor.
Chart
A chart displays the value of the counter over time. Many counters may be charted at one
time.
Report
A report shows the value of the counter. A report of all the counters in Performance Monitor
can be created.
Alex Mita Salinas
Gerente de Cuentas Microsoft
amita@cosapidata.com.pe
Telefono: 221-2180 anx 2211 / Celular: 975-6659
Alert
In this view, alerts are set on a counter. This causes an event to be displayed when the
counter attains a specified value. Many alerts can be monitored at one time.
Log
In the Log view, the counters are recorded on disk for future analysis. Log files are fed back
into Performance Monitor to create charts, reports, or alerts.
Performance Monitor Chart View
Customized charts that monitor the current performance of selected counters and instances
are useful when:
Investigating why a computer or application is slow or inefficient.
Continuously monitoring systems to find intermittent performance problems.
Discovering why capacity needs to be increased.
Different graphs require different settings. Creating charts to reflect these settings requires
selecting the computer to be monitored and adding the appropriate objects, counters, and
instances. These selections can be saved under a filename for viewing whenever an update
on their performance is needed.
To enhance the readability of graphs, vary the scale of the displayed information and the
color, width, and style of the line for each counter. You can also modify these properties after
a selection is added.
The scale of any displayed value can be changed so that it is displayed in a chart or so that it
can be compared with another value. To make very large or small values noticeable, change
the vertical maximum on the chart.
In addition, you can use Chart Options, to customize charts and to change the method used
for updating the chart values.
Note Selecting a counter and then pressing the CTRL+H keys will highlight that counter on
the chart.
Performance Monitor Report View
Alex Mita Salinas
Gerente de Cuentas Microsoft
amita@cosapidata.com.pe
Telefono: 221-2180 anx 2211 / Celular: 975-6659
The Report view displays constantly changing counter and instance values for added
objects. Values appear in columns for each instance. Report intervals are adjusted,
snapshots printed, and data reported or displayed. Reports of averaged counters show the
average value during the Time Window interval. Reports of instantaneous counters show the
value at the end of the Time Window interval.
Creating reports using current activity can help gain a better understanding of object
behavior. The Report view allows:
Creating a report on all the counters for a given object and then watching them change
under various loads.
Creating reports to reflect the same information that is charting or to monitor other
specific situations. These selections can then be saved under a filename and reused
when an update on the same information is needed.
After selections are added to a report, the selections, listed by computer and object, appear
in the report area, and Performance Monitor displays the changing values of the selections in
the report.
Performance Monitor Alert View
The Alert view enables a person to continue working while Performance Monitor tracks
events and notifies the person if requested. Use the Alert view to create an alert log that
monitors the current performance of selected counters and instances for objects.
With the alert log, several counters can be measured at the same time. When a counter
exceeds a given value, the date and time of the event are recorded in the Alert view. One
thousand events are recorded, after which the oldest event is discarded when a new one is
Alex Mita Salinas
Gerente de Cuentas Microsoft
amita@cosapidata.com.pe
Telefono: 221-2180 anx 2211 / Celular: 975-6659
added. An event can also generate a network alert. When an event occurs, a specified
program can be run every time or just the first time that it occurs.
Alert logs can be created to warn of problems in different situations. These selections can be
saved under a filename and reused to see if the problem has been fixed.
An alert condition applies to the value of the counter over the time interval specified. The
default time interval is five seconds. If an alert is set on Memory: Pages/sec > 50 using the
default time interval, the average paging rate for a five-second period has to exceed 50 per
second before the alert is triggered.
Note Alerts cannot be set on two conditions of the same counter for the same instance. For
example, an alert cannot be set to be triggered when Processor: %Processor Time on a
single processor exceeds 90 percent and another to be triggered when it falls below 30
percent.
Also, an alert cannot be set on more than one instance of an object with the same name. For
example, if two processes are running with the same name, an alert can only be set for the
first instance of the process. Both instances will appear in the Instances box, but only data
collected from the first instance will trigger the alert.
Performance Monitor Log View
Logging is recording information on the current activity of added objects for later viewing.
Data can also be collected from multiple systems into a single log file. Log files contain
detailed data for detecting performance problems or other detailed analysis. For server
analysis and forecasting future resources allocation, it allows the viewing of trends over a
long period, and appending or re-logging files. Log file data is charted, reported, or exported
to compare files or examine patterns.
Log view has a display area for listing objects and their corresponding computers. All
counters and instances are logged for a selected object.
When logging is started, a log symbol with the changing total file size appears on the right
side of the status bar.
Log files become more usable when bookmarks are added at various points while logging.
With bookmarks, major points of interest can be highlighted, or the circumstances under
which the file was created can be described. These locations are easily returned to when
working with the log file. The Bookmark option becomes available when logging is started.
Note Opening a log that is collecting data will stop the log and clear all counter settings.
Performance Monitor does not allow peeking at the log from Chart or Report view because
Alex Mita Salinas
Gerente de Cuentas Microsoft
amita@cosapidata.com.pe
Telefono: 221-2180 anx 2211 / Celular: 975-6659
the views share the same data source. To peek at a running log, start a second copy of
Performance Monitor, and set Data From to the running log.
No matter which view you use—Chart, Alert, Report, or Log—standard built-in features make
Performance Monitor more flexible. Performance Monitor allows:
Using the Update Interval to determine how often performance is measured. There is a
tradeoff between the precision of the data and Performance Monitor overhead.
Using the PRINT SCREEN key to save a bitmap image of the Performance Monitor
screen. The image can then be printed or inserted into a document.
Clearing the Performance Monitor window, deleting a counter, or deleting the full screen.
Exporting the data in a tab-delimited (.tsv) or comma-delimited (.csv) text file to a
spreadsheet or database program.
For specific instructions on these topics, use Performance Monitor Help.
Six-Step Process to Server Analysis and Optimization
Before starting server analysis and optimization, have a strategy or procedure to ensure all
goals are accomplished. The following list of steps to follow when performing server analysis
and optimization has been adapted from an industry standard strategy. Each step in this
process is described in more detail in the upcoming modules.
Creating a Measurement Baseline
The first step in “A Windows NT Server Approach to Server Analysis and Optimization”
involves creating a measurement baseline.
Alex Mita Salinas
Gerente de Cuentas Microsoft
amita@cosapidata.com.pe
Telefono: 221-2180 anx 2211 / Celular: 975-6659
A measurement baseline is a collection of data that indicates how individual system
resources, a collection of system resources, or the system as a whole is being used. This
information is compared with later activity to help determine system usage and system
response to that usage.
When creating a measurement baseline, start by identifying the resources that need to be
measured. As a rule, monitor all four of the major server resources no matter which Windows
NT Server environment (file and print server, application server, or domain server) is the
focus. Although the implications in each server environment are different, include memory,
processor, disk, and network objects in the baseline regardless of the environment.
Depending on the server environment, you may need to monitor additional resources and
objects. The specific implication of resources in each environment is discussed in Modules 4,
5, and 6.
Some measurement tools are capable of analyzing the captured data and storing it in the
format of the native tool. If a tool cannot provide or is not providing what is needed for
analysis, export the data to another application. This new application could be a database
application, such as Microsoft Access or Microsoft SQL Server, or a spreadsheet application
such as Microsoft Excel.
Once the particular set of data is originally captured, regularly capture it and place it in the
database. This provides the ability to analyze trends over time.
Listed below are general Performance Monitor objects that may be used to monitor the four
server analysis and optimization resources.
Resources
Objects to include
Memory
Memory (include Cache in the Application Server environment)
Processor
Processor, System, Server Work Queues
Disk subsystem PhysicalDisk, LogicalDisk
Network subsystem
Server, Network Segment, Network Interface
Optional objects
Application-specific objects, such as SQL Server, WINS Server, Browser,
and RAS
Using Performance Monitor to Create a Measurement Baseline
As discussed in the previous module, Performance Monitor performs data collection and
analysis. It can assist with server analysis and optimization in the following two ways:
Creating a measurement baseline.
Isolating and gathering data to be placed into a database.
Alex Mita Salinas
Gerente de Cuentas Microsoft
amita@cosapidata.com.pe
Telefono: 221-2180 anx 2211 / Celular: 975-6659
Performance Monitor uses objects and counters to associate statistical information with
monitored components. The important features of Performance Monitor for server analysis
and optimization are logging, re-logging, and appending log files.
Prior to logging, first select a set of objects to log. For server analysis, it is generally
recommended to log the following:
System
Processor
Memory
Logical disk
Physical disk (if using RAID)
Server
Cache
Network adapter
Network segment activity on at least one server in the segment
If you are monitoring RAID disks, be sure to start diskperf with the -ye option.
When re-logging, increase the Log Option and update Time Interval to reduce the amount of
data saved. If the original log file is recorded at 60 seconds, and the new file is recorded at
600 second intervals (which is fine for most server analysis uses), the new file will be about
one-tenth the size of the original log file. To increase the Log Option and update Time
Interval, on the Options menu, click Data From.
Consider appending log files to a master log file to create a single log archive. When relogging, use the name of the archive log file. The new data will be appended at the end. The
format of an archive log file is identical to a normal log file. Bookmarks are automatically
inserted to mark the start of each appended log to ease browsing of the archive log file.
Take measurements over a week or more to get a complete measurement baseline. As
previously mentioned, concentrate on the periods of peak activity—the baseline will indicate
these periods.
Using Performance Monitor for Automating Data Collection
The Performance Monitor Service utilities provided in the Windows NT Resource Kit can be
used to automate monitoring. It creates log files in the same format that Performance
Monitor does. To do this, use Performance Monitor to specify the data to be collected. Set
the update Time Interval option to the desired frequency for data collection. Name the log
file and save the settings in a Performance Monitor Workspace settings file. Configure the
Performance Monitor Service to start automatically when the systems boots.
Note Performance Monitor log files can be quite large in size. Make sure adequate disk
resources are available for storage of the log file or files. Identify the data that will help in
server optimization. Spend time analyzing this data. This can help prevent overloading the
system, or prevent you from being overwhelmed by the amount of data.
Be sure to create this database on a computer that is not being monitored. If the database is
on the same computer, it affects the data being measured.
Establishing a Database of Measurement Information
Alex Mita Salinas
Gerente de Cuentas Microsoft
amita@cosapidata.com.pe
Telefono: 221-2180 anx 2211 / Celular: 975-6659
The second step in “A Windows NT Server Approach to Server Analysis and Optimization” is
to establish a database of measurement information. This step involves collecting
information over a period of time and adding that information to a database for the purposes
of analyzing past performance and measuring trends over time.
Information in a database is measurable, manageable, and accessible for analysis.
Database utilities greatly complement the data collection utilities. Data collection utilities
gather large amounts of information; use the database utilities to organize the information
into manageable and meaningful subsets. Once data has been collected from all four major
resources and added to the database, use the database utility to analyze and pinpoint
specific areas of interest or concern, such as the disk subsystem.
Creating a Database Using Different Applications
To create a database of measurement information for a Windows NT Server system,
numerous applications may be used, such as:
Performance Monitor
Microsoft Excel
Microsoft SQL Server
Microsoft Access
Microsoft FoxPro®
As mentioned earlier in this module, Performance Monitor is an integrated tool for collecting
measurement data for a Windows NT–based system. The data is collected and saved in log
files. These log files, representing data that is collected over time, are displayed as charts or
reports within Performance Monitor, or can be exported to other applications.
Microsoft Excel can be used to import the data from Performance Monitor log files. The data
can then be manipulated and analyzed to identify trends and system bottlenecks. You can
use the Microsoft Excel macro language or Microsoft Visual Basic to automate the dataanalysis process.
Microsoft database applications, such as Microsoft Access, Microsoft FoxPro, and Microsoft
SQL Server can be used to import and store large amounts of management data for further
analysis using complex searches and queries. Once the data from Performance Monitor is
imported into a database application, numerous methods of analysis are available.
Although the actual applications and methods that are used vary, what is crucial is that data
is collected over time, and is saved for later analysis. The process of analyzing the data is
covered in the “Performance Analysis, Forecasting, and Record Keeping” module.
Alex Mita Salinas
Gerente de Cuentas Microsoft
amita@cosapidata.com.pe
Telefono: 221-2180 anx 2211 / Celular: 975-6659
Windows NT Server Environments
Before analysis and optimization on a Windows NT Server can begin, determine the type of
environment being analyzed. Windows NT Server environments generally fit into one of
three categories: file and print server, application server, and domain server. Each of these
involves different monitoring considerations and considerations on how to set expectations
when performing server analysis and optimization.
File and Print Server
A file and print server is usually accessed by users for data retrieval and document storage,
and occasionally for loading application software over the network.
Application Server
An application server is accessed by users in a client/server environment. The server runs
an applications engine that users access using a front-end application.
Domain Server
A domain server is a server that generates data transfer between itself and other servers. A
primary domain controller, for example, synchronizes the accounts database with backup
domain controllers, or a WINS Server replicates its database with its replication partner.
Domain servers also validate user logon requests.
Determining Workload Characterization
Alex Mita Salinas
Gerente de Cuentas Microsoft
amita@cosapidata.com.pe
Telefono: 221-2180 anx 2211 / Celular: 975-6659
Before expectations can be set for a system, it is necessary to know what is being requested
of the system. This process is called workload characterization. A workload unit is a list of
service requests made on the system or on a specific resource on the system. Examples of
workload units are the number of disk access attempts per second, the number of bytes
transferred per second, or the process of receiving data from a server (the client sending a
request over the network to the server, the server responding over the network to the client).
Determining workload characterization requires understanding what is happening in a
specific environment. In a file and print server environment, the area of most concern is disk
I/O or the number of users accessing a server, whereas in an application server, the area of
most concern is how much memory an application is using. That is not to say that memory
usage is not important on a file and print server; rather, concentrate on the device that has
the best chance of becoming a system bottleneck.
In a Windows NT Server environment, the two most common workload characteristics are
the number of users the system can support and the expected response time for a specific
transaction or task (such as copying a file from the server) given a certain number of users
on a specific set of hardware.
Determine what is important to each system by the type of work being performed. This is
essential to proper server analysis and optimization.
System Bottlenecks
During the process of determining workload characterization, it is possible to encounter a
resource that is not performing properly. The response to file access requests, for example,
may be much too long for the number of users accessing the server. In this case, a symptom
of a bottleneck has been detected.
A bottleneck is the part of the system that is currently restricting workflow. Generally, it is the
over-consumption of a specific resource. It may be that the disk controller or drive is
extremely slow accessing data, or that the processor is running at 100 percent utilization, or
that too many active processes need access to RAM. Whatever is causing system
responsiveness to suffer is the bottleneck.
It is very common that once one bottleneck has been identified and solved, another
bottleneck appears. This new bottleneck was either unnoticed because of the severity of the
previous bottleneck, or the new bottleneck was caused by solving the initial bottleneck. If the
new bottleneck was caused by solving the initial bottleneck, the new bottleneck may have
created more demand on another resource, causing it to become the restriction to work flow.
Bottleneck detection is the process of isolating the hardware components that restrict the
flow of your work.
Alex Mita Salinas
Gerente de Cuentas Microsoft
amita@cosapidata.com.pe
Telefono: 221-2180 anx 2211 / Celular: 975-6659
System bottlenecks generally appear within the four major server analysis and optimization
resources introduced in “The Basics of Server Analysis and Optimization” module: memory,
processor, the disk subsystem, and the network subsystem. Within a Windows NT
environment, use Performance Monitor to monitor current activity to determine if any system
bottlenecks are present.
Note After successfully identifying and resolving system bottlenecks, be sure to repeat
steps one and two of the “Windows NT Server Approach to Server Analysis and
Optimization.” Do this before analyzing for capacity performance and expected system use.
Using Performance Monitor to Chart Bottlenecks
Performance Monitor collects data about objects (system resources) and counters (attributes
or statistical information that is gathered on an object). This information helps to isolate and
identify bottlenecks.
Recall that when adding objects to a log, all counters for the selected objects are collected
automatically.
To identify statistical information for each of the individual attributes, use the data from the
log file, and view it in a chart or report format. Viewing the information this way allows the
selection of individual counters for each of the captured objects.
Finding Memory Bottlenecks
The most common resource bottleneck within Windows NT Server is memory— specifically
RAM (random-access memory). If only one thing is done to improve performance in a server,
it should be the addition of memory.
Paged and Non-paged RAM
RAM in the Windows NT operating system is divided into two categories: paged and nonpaged. Paged RAM is virtual memory, where all applications believe they have a full range of
memory addresses available. Windows NT does this by giving each application a private
memory range called a virtual memory space and by mapping that virtual memory to
physical memory.
Non-paged RAM cannot use this configuration. Data placed into non-paged RAM must
remain in memory and cannot be written to or retrieved from disk. For example, data
structures used by interrupt routines or those that prevent multiprocessor conflicts within the
operating system use non-paged RAM.
Alex Mita Salinas
Gerente de Cuentas Microsoft
amita@cosapidata.com.pe
Telefono: 221-2180 anx 2211 / Celular: 975-6659
Virtual Memory System
The virtual memory system in Windows NT 4.0 combines physical memory, the file system
cache, and disk into an information storage and retrieval system. The system stores program
code and data on disk until it is needed, and then moves it into physical memory. Code and
data no longer in active use is written back to disk. However, when a computer does not
have enough memory, code and data must be written to and retrieved from the disk more
frequently—a slow, resource-intensive process that can become a system bottleneck.
Hard Page Faults
The best indicator of a memory bottleneck is a sustained, high rate of hard page faults. Hard
page faults occur when the data a program needs is not found in its working set (the physical
memory visible to the program) or elsewhere in physical memory, and must be retrieved
from disk. Sustained hard page fault rates—over five per second—are a clear indicator of a
memory bottleneck.
Note For information on virtual memory, see the Supporting Microsoft Windows NT 4.0
Core Technologies course.
Use the following list of Performance Monitor memory counters to determine if RAM is a
bottleneck in the system:
Pages/sec—This is the number of requested pages that were not immediately available
in RAM, and thus had to be accessed from the disk, or had to be written to the disk to
make room in RAM for other pages. Generally, if this value has extended periods with
the number of pages per second over five, memory may be a bottleneck in the system.
Available Bytes—This indicates the amount of available physical memory. It will normally
be low, as the Windows NT Disk Cache Manager uses extra memory for caching and
then returns it when requests for memory occur. However, if this value is consistently
below 4 MB on a server, it is an indication that excessive paging is occurring.
Committed Bytes—This indicates the amount of virtual memory that has been committed
to either physical RAM for storage, or to pagefile space. If the amount of committed
bytes is larger than the amount of physical memory, it may indicate that more RAM is
required.
Pool Nonpaged Bytes—This indicates the amount of RAM in the Non-paged pool system
memory area where space is acquired by operating system components as they
accomplish their tasks. If the Pool Nonpaged Bytes value has a steady increase without
a corresponding increase in activity on the server, it may indicate that a process that is
running has a memory leak, and it should be monitored closely.
Counter
Acceptable
average range Desire high or low value
Action
Pages/sec
0–20 Low
Find process that is causing paging.
Add RAM.
Available Bytes Minimum of 4 MB
High
Find process using RAM.
Add RAM.
Committed Bytes
Less than physical RAM
Low
Find process using RAM.
Add RAM.
Alex Mita Salinas
Gerente de Cuentas Microsoft
amita@cosapidata.com.pe
Telefono: 221-2180 anx 2211 / Celular: 975-6659
Pool Non-paged Bytes Remain steady, no increase
in application.
Not applicable Check for memory leak
Finding Processor Bottlenecks
Just about everything that occurs on a server involves the CPU. The processor on an
application server is generally busier than the processor on a file and print server. As a
result, the processor activity and what is considered normal are different between the two
types of servers.
Two of the most common causes of CPU bottlenecks are CPU-bound applications and
drivers, and excessive interrupts that are generated by inadequate disk or network
subsystem components.
Monitor the following Performance Monitor processor counters to help determine if the
processor is a bottleneck:
% Processor Time—This measures the amount of time the processor is busy. When a
processor is consistently running over 75 percent processor usage, the processor has
become a system bottleneck. Analyze processor usage to determine what is causing the
processor activity. This is accomplished by monitoring individual processes. If the
system has multiple processors, then monitor the counter "System: % Total Processor
Time."
% Privileged Time—This measures the time the processor spends performing operating
system services.
% User Time—This measures the time the processor spends performing user services,
such as running a word processor.
Interrupts/sec—This is the number of interrupts the processor is servicing from
applications or from hardware devices. Windows NT Server can handle thousands of
interrupts per second. However, if the number of interrupts consistently exceeds 1,000
on a 80486/66-based system, or 3,500 on a Pentium 90 PCI bus system, a hardware
error or interrupt conflict with devices may be occurring. For example, if a conflict occurs
between a hard disk controller and a network adapter card, monitor the disk controller
and network adapter card to see if excessive requests are being generated. This is done
by monitoring the queue lengths for the physical disk and network interface. Generally, if
the queue length is greater than two requests, check for slow disk drives or network
adapters that could be causing the queue length backlog.
System: Processor Queue Length—This is the number of requests the processor has in
its queue. It indicates the number of threads that are ready to be executed and are
waiting for processor time. Generally, a processor queue length that is consistently
Alex Mita Salinas
Gerente de Cuentas Microsoft
amita@cosapidata.com.pe
Telefono: 221-2180 anx 2211 / Celular: 975-6659
higher than two may indicate congestion. Further analysis of the individual processes
making requests on the processor is required to determine what is causing the
congestion.
Server Work Queues: Queue Length—This is the number of requests in the queue for
the selected processor. A consistent queue of over two indicates processor congestion.
Counter
Acceptable
average range Desire high or low value
Action
% Processor Time
Less than 75% Low
Find the process using excessive processor time.
Upgrade or add another processor.
% Privileged Time
Less than 75% Low
Find the process using excessive processor time.
Upgrade or add another processor.
% User Time Less than 75% Low
Find the process using excessive processor time.
Upgrade or add another processor.
Interrupts/sec Depends on processor Low
Find the controller card generating interrupts.
System: Processor Queue Length
Less than two Low
Upgrade or add additional
processor.
Server Work Queues:
Queue Length Less than two Low
Find the process using excessive processor time.
Upgrade or add another processor.
Another tool that can be used for finding memory bottlenecks is the Windows NT Task
Manager. One of the capabilities that Task Manager provides is an analysis of the amount of
memory used.
If it is determined that the processor is a system bottleneck, a number of actions can be
performed to improve performance. These include the following:
Add a faster processor if the system is a file and print server.
Add multiple processors for application servers, especially if the application is
multithreaded.
Off-load processing to another system in the network (either users, applications, or
services).
Finding Disk Bottlenecks
Alex Mita Salinas
Gerente de Cuentas Microsoft
amita@cosapidata.com.pe
Telefono: 221-2180 anx 2211 / Celular: 975-6659
Disks store programs and the data that programs process. While waiting for a computer to
respond, it is frequently the disk that is the bottleneck. In this case, the disk subsystem can
be the most important aspect of I/O performance, but problems can be hidden by other
factors such as the lack of memory.
Performance Monitor disk counters are available with either the LogicalDisk and
PhysicalDisk objects. LogicalDisk monitors logical partitions of physical drives. It is useful to
determine which partition is causing the disk activity, possibly indicating the application or
service that is generating the requests. PhysicalDisk monitors individual hard disk drives,
and is useful for monitoring disk drives as a whole.
Performance Monitor disk counters, however, are not enabled by default and must be
enabled manually.
To activate disk performance statistics on the local computer
1. Start a command prompt, and type diskperf -y
2. Restart the computer.
To activate disk performance on a remote computer called Server1
1. Start a command prompt, and type diskperf -y \\server1
2. Restart the remote computer.
If using a RAID implementation, start diskperf with the -ye parameter to get enhanced
counters.
When analyzing disk subsystem performance and capacity, monitor the following
Performance Monitor disk subsystem counters for bottlenecks:
% Disk Time—This indicates the amount of time that the disk drive is busy servicing read
and write requests. If this is consistently close to 100 percent, the disk is being used very
heavily. Monitoring of individual processes will help determine which process or
processes are making the majority of the disk requests.
Disk Queue Length—Indicates the number of pending disk I/O requests for the disk
drive. If this value is consistently over two, it indicates congestion.
Avg. Disk Bytes/Transfer—The average number of bytes transferred to or from the disk
during write or read operations. The larger the transfer size, the more efficient the
system is running.
Disk Bytes/sec—This is the rate bytes are transferred to or from the disk during write or
read operations. The higher the average, the more efficient the system is running.
Counter
Acceptable
average range Desire high or low value
Action
% Disk Time Under 50%
Low
Monitor to see if paging is occurring.
Upgrade disk subsystem.
Disk Queue Length
0–2
Low
Upgrade disk subsystem.
Avg. Disk Bytes/Transfer
Depends on subsystem High
Upgrade disk subsystem.
Disk Bytes/sec Depends on subsystem High
Upgrade disk subsystem.
Alex Mita Salinas
Gerente de Cuentas Microsoft
amita@cosapidata.com.pe
Telefono: 221-2180 anx 2211 / Celular: 975-6659
If you determine that the disk subsystem is a system bottleneck, a number of solutions are
possible. These solutions include the following:
Add a faster controller, such as Fast SCSI-2, or an on-board caching controller.
Add more disk drives in a RAID environment. This spreads the data across multiple
physical disks and improves performance, especially during reads.
Offload processing to another system in the network (either users, applications, or
services).
Finding Network Bottlenecks
Network bottlenecks are one of the more difficult areas to monitor due to the complexity of
most networks today. As outlined in the “The Basics of Server Analysis and Optimization”
module, a number of different issues can affect the performance of the network. While
monitoring the network, a number of different objects and counters can be monitored, such
as server, redirector, network segment, and protocols. Determining which ones to monitor
depends upon the environment. Below are commonly monitored counters. Use them to form
an overall picture of how the network is being used and to help in attempts to uncover
bottlenecks.
Server: Bytes Total/sec—This is the number of bytes the server has sent and received
over the network. It indicates how busy the server is for transmission and reception of
data.
Server: Logon/sec—This is the number of logon attempts for local authentication, overthe-network authentication, and service accounts in the last second. This counter is
beneficial on a domain controller to determine the amount of logon validation occurring.
Server: Logon Total—This is the number of logon attempts for local authentication, overthe-network authentication, and service accounts since the computer was last started.
This counter is beneficial on a domain controller to determine the amount of logon
validation occurring.
Network Segment: % Network utilization—This is the percentage of the network
bandwidth in use for the local network segment. This can be used to monitor the effect of
different network operations on the network, such as user logon validation or domain
account synchronization.
Note The Network Segment counters are added when the Network Monitor Agent is
added through Network Services in Control Panel. When Performance Monitor is actively
monitoring Network Segment counters, it places the adapter card into promiscuous
mode. While in promiscuous mode, the network adapter card accepts and processes all
Alex Mita Salinas
Gerente de Cuentas Microsoft
amita@cosapidata.com.pe
Telefono: 221-2180 anx 2211 / Celular: 975-6659
network traffic, not just traffic destined for itself. This should only be done occasionally
and not left for extended periods, as the processing of all network traffic will affect the
performance of the system running the Network Monitor Agent software.
Network Interface: Bytes Sent/sec—This is the number of bytes sent using this network
adapter card.
Network Interface: Bytes Total/sec—This is the number of bytes sent and received using
this network adapter card.
Note The Network Interface counters are added to a TCP/IP host when the SNMP
Service is added. These may be added using the Network services in Control Panel.
Counter
Acceptable
average range Desire high or low value
Action
Bytes Total/sec Function of number of NICs and protocols used.High
Further analysis to
determine cause of problem. Add another adapter.
Logon/sec
Not applicable High
If logon validation is not completed, add additional
domain controllers.
Logons Total Not applicable High
If logon validation is not completed, add additional
domain controllers.
Network Segment:
% Network Use Generally lower than 30%, though switched networks can achieve higher use.
Low
Segment the network.
Limit the protocols in use.
Network Interface:
Bytes Sent/sec Function of NIC and protocol or protocols.
High
Upgrade network
adapter/physical network.
Network Interface:
Bytes Total/sec Function of NIC and protocol or protocols.
High
Upgrade network
adapter/physical network.
By viewing the above counters, it is possible to view the amount of activity on the server for
logon requests and data access. If by monitoring these or other counters, the network
subsystem is determined to be a bottleneck, numerous actions can help alleviate the
bottleneck. These actions include the following:
Improve the hardware of the server by:
Adding an additional network adapter.
Upgrading to a better performing adapter.
Upgrading to better performing routers and bridges.
Add more servers to the network, thereby distributing the processing load.
Check and improve the physical layer components, such as routers.
Segment the network to isolate traffic to appropriate segments.
Monitoring Network Protocols
Alex Mita Salinas
Gerente de Cuentas Microsoft
amita@cosapidata.com.pe
Telefono: 221-2180 anx 2211 / Celular: 975-6659
In addition to objects and counters, it is also important to monitor how network protocols
affect the network; protocols affect the number of broadcast datagrams being generated and
the number of retransmissions occurring. By monitoring appropriate counters for the
protocols in the environment, a clear picture of the use of the network bandwidth in the
protocol is determined.
NetBEUI and NWLink
Both NetBEUI and NWLink have similar counters. The following are three common counters
for monitoring:
Bytes Total/sec—This is the total number of bytes sent in frames (data packets) and
datagrams (such as broadcasts and acknowledgments).
Datagrams/sec—The number of non-guaranteed datagrams (broadcasts and
acknowledgments) sent and received on the network.
Frames/sec—The number of data packets that have been sent and received on the
network.
Counter
Acceptable
average range Desire high or low value
Action
Bytes Total/sec Function of number of NICs and activity High
Upgrade NIC; add additional
NIC.
Datagrams/sec Function of activity
High
Monitor process to determine if causing
excessive datagrams.
Frames/sec
Function of activity
High
Reduce broadcast traffic.
TCP/IP
TCP/IP counters are added to a system when the TCP/IP protocol has been installed, and
the SNMP Service has been installed. The SNMP Service contains the following objects and
counters for TCP/IP related protocols:
TCP Segments/sec—The number of TCP segments (frames) that are sent and received
over the network.
TCP Segments Re-translated/sec—The number of frames (segments) that are retranslated on the network.
UDP Datagrams/sec—The number of UDP datagrams (such as broadcasts) that are
sent and received.
Alex Mita Salinas
Gerente de Cuentas Microsoft
amita@cosapidata.com.pe
Telefono: 221-2180 anx 2211 / Celular: 975-6659
Network Interface: Output Queue Length—The length of the output packet queue (in
packets). Generally, a queue longer than two indicates congestion, and analysis of the
network structure to determine the cause is necessary.
Counter
Acceptable
average range Desire high or low value
Action
TCP Segments/sec
Function of activity
High
Reduce broadcast traffic.
Segment network.
TCP Segments
Re-translated Not applicable Low
Upgrade physical hardware.
Segment network.
UDP Datagrams/sec
Function of activity
Low
Reduce broadcasts.
Network Interface:
Output Queue Length Less than two Low
Upgrade NIC, add additional NIC, verify physical
network components.
© 1997 Microsoft Corporation. All rights reserved.
The information contained in this document represents the current view of Microsoft
Corporation on the issues discussed as of the date of publication. Because Microsoft must
respond to changing market conditions, it should not be interpreted to be a commitment on
the part of Microsoft, and Microsoft cannot guarantee the accuracy of any information
presented after the date of publication.
This document is for informational purposes only. MICROSOFT MAKES NO WARRANTIES,
EXPRESS OR IMPLIED, IN THIS SUMMARY.
Microsoft, FoxPro, Visual Basic, Win32, and Windows NT are registered trademarks of
Microsoft Corporation.
Other product or company names mentioned herein may be the trademarks of their
respective owners.
Alex Mita Salinas
Gerente de Cuentas Microsoft
amita@cosapidata.com.pe
Telefono: 221-2180 anx 2211 / Celular: 975-6659
