CATT_Final_Report - Capita - Washington University in St. Louis
advertisement
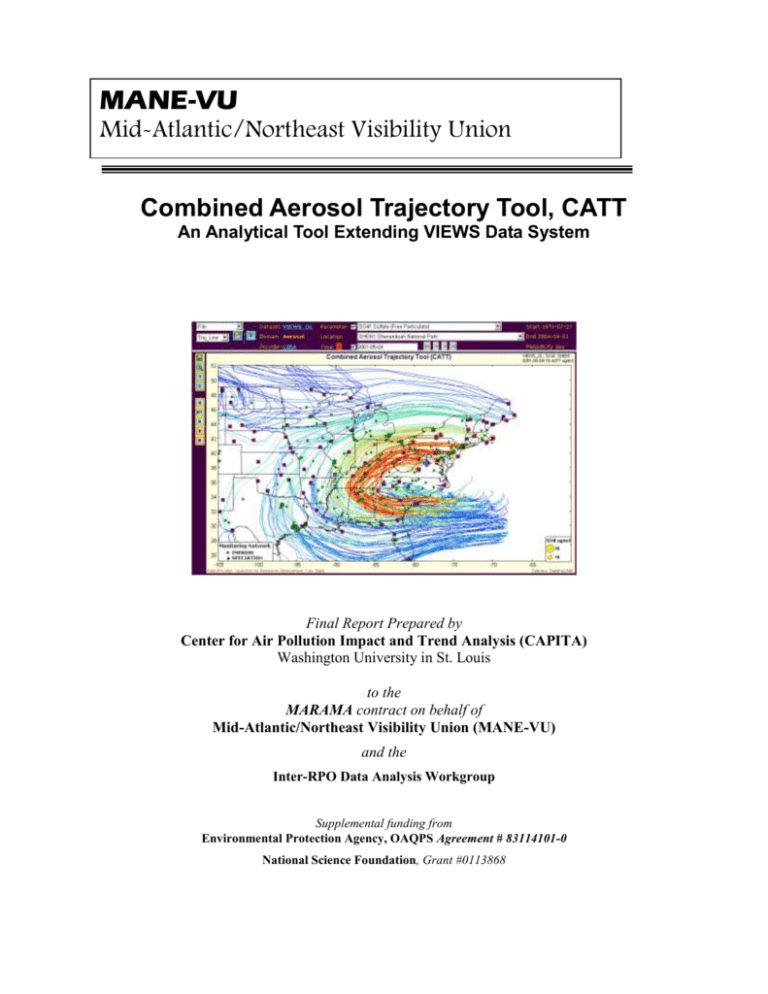
MANE-VU Mid-Atlantic/Northeast Visibility Union Combined Aerosol Trajectory Tool, CATT An Analytical Tool Extending VIEWS Data System Final Report Prepared by Center for Air Pollution Impact and Trend Analysis (CAPITA) Washington University in St. Louis to the MARAMA contract on behalf of Mid-Atlantic/Northeast Visibility Union (MANE-VU) and the Inter-RPO Data Analysis Workgroup Supplemental funding from Environmental Protection Agency, OAQPS Agreement # 83114101-0 National Science Foundation, Grant #0113868 ACKNOWLEDGEMENTS MARAMA gratefully acknowledges the funding support provided by the United States Environmental Protection Agency under agreements with the Mid-Atlantic/Northeast Visibility Union and the Midwest Regional Planning Organization. Numerous individuals provided directions guiding the project, reviewed the drafts of this report and gave insightful comments including: Donna Kenski, LADCO Serpil Kayin, MARAMA Gary Kleiman, NESCAUM Rich Poirot, Vermont DEC Susan Wierman, MARAMA Paul Wishinski, Vermont DEC Kristi Gebhart, National Parks Service/CIRA Bret Schichtel, National Parks Service/CIRA Final Interim Report ii January 2003 A. Introduction The Visibility Information Exchange Web System (VIEWS) is an online exchange of visibility data, research, and ideas. The VIEWS web system contains an array of visibility related data for use by the Regional Planning Organizations (RPOs). The evolving VIEWS system also performs extensive data summarization, calculations and delivers the raw and processed data through a simple, user-friendly web interface. The main application of VIEWS is to aid RPOs and the states in the implementation of regional haze regulations over the next years. The VIEWS system is operated at Colorado State University, Cooperative Institute for Research in the Atmosphere (CIRA), under contract from RPOs. The Center for Air Pollution Impact and Trend Analysis (CAPITA) at Washington University in St. Louis has been developing a number of software tools for the analysis, exploration, and presentation for air quality data. Most recently, with support from NSF and NASA, CAPITA has developed the DataFed (Data Federation) infrastructure for web-based sharing, browsing, and processing of distributed air quality data. One of the applications built on the DataFed infrastructure is tool for Combined Aerosol Trajectory Tool (CATT) for the exploration of airmass transport pattern under specified chemical conditions. The CATT tool received initial funding from the Mid-Atlantic/Northeast Visibility Union/Midwest Regional Planning Organization (MANEVU/MRPO) RPOs. This project is an extension of the initial CATT residence time analysis tool. A key feature of the expanded CATT tool is the applicability to all RPOs. The extensions include spatial coverage of the entire US and also incorporation of all chemical parameters in the VIEWS aerosol chemistry database. With CATT, investigators in any of the RPOs or states can: a. Explore the airmass histories associated with any chemical conditions. b. Render the associated residence times as contours or trajectories. c. Superimpose the transport data on other spatial data sets (emissions, satellites) CATT is designed and implemented as a community tool. Both the data as well as the processing routines are contributed by the air quality analysis community. 3 Figure 1 CATT as a community tool. Based on experience in developing the prototype CATT tool the software consists of two rather independent components: 1. Chemical filter component. This component is accomplished through queries to chemical data sets. The output of this step is a list of “qualified” dates for a specific receptor location. 2. Trajectory aggregator component. This component receives the list of dates for a specific location and performs the trajectory aggregation, residence time calculation and other spatial operations to yield a transport pattern for specific receptor location and chemical conditions. The two software components have substantial utility individually as well as linked as a single tool. 4 Figure 2. CATT components B. Summary Report on Contract Tasks The main goal of the project was to develop an analysis tool for exploring the geographic origin of airmasses with specific chemical composition. This necessitated combining the aerosol chemistry and air transport data in practical web based tool and making it accessible to the air quality analyst community. The specific contractual tasks for this phase of the CATT project consist of four major tasks: Connecting the CATT tool to the VIEWS aerosol chemistry database Implementing spatial rendering (trajectory/grid/contour) of transport data Implementing superposition of multiple GIS map layers Maintenance of the CATT web server for one year. In this section the results of these contractual task are summarized. Connecting the CATT tool to the VIEWS aerosol chemistry database The connection of the CATT tool to the VIEWS database has been completed. The CATT tool has been connected to the SQL server VIEWS database at CIRA. The relevant VIEWS data tables have also been transferred to the DataFed server and repackaged for fast access, processing, and rendering. The resulting VIEWS “data cubes” allow easy browsing of the connected chemical and trajectory data. The CATT data analysis services are delivered through a separate web server hardware/software system dedicated for this purpose, as shown in Figure 3. 5 Figure 3. Networking connection between the DataFed Analytical Server (blue middle) to VIEWS and CAPITA servers. The integration of the proposed data analysis tools with the VIEWS system was the subject of numerous discussions between the system designers at CIRA and CAPITA. The above design and implementation has the benefit that it eliminates intrusive, low level interaction between the two systems. Instead, the CIRA and CAPITA systems can be developed independently, but connected through standard web-links. This design simply requires that the CIRA-VIEWS data sets and the CAPITA software be routinely updated in the new server by their respective custodians. Implementing spatial rendering (trajectory/grid/contour) of transport data The trajectory/residence time rendering is now implemented is ready for user feedback. The two major transport display modes are trajectory and residence time grid. Both trajectory rendering approaches are illustrated below. A more detailed explanation of trajectory and grid rendering is given in section C. Illustrated Instruction Manual for CATT. 6 The trajectory rendering includes weight functions representing the (1) chemical concentration associated with the trajectory and (2) distance (age) of the trajectory point from the receptor. The trajectory color is linked to the concentration weight and the point size is proportional to the distance (age) weight. 7 Figure 4. Rendering of ensemble trajectories. Weights are represented by color and point circle size. 8 Figure 5. User input screen for the CATT chemical filter The spatial density of the ensemble trajectories is d The trajectory end points are summed for each grid and the total number of endpoints in a grid represents the residence time map. For sake of uniformity, the residence time grid is normalized by the total number of endpoints. Note that trajectory endpoints are also weighed by chemical concentrations and distance. Figure 6. Contour plot of the CATT residence time distribution for specific chemical conditions. 9 Transport Probability Metrics The transport metric is calculated from two residence time grids, one for all trajectories and another for trajectories on selected (filtered days). Both residence time grids are normalized by the sum of all residence times in all grid cells: pijf=rij/ rij pija=rij/ rijpijf, is the filtered and pija is the unfiltered residence time probability that an air masses passes through a specific grid. There is a choice of transport probability metrics: The Incremental Residence Time Probability (IP) proposed by Poirot et al., 2001 is obtained by subtracting the chemically filtered grid from the unfiltered residence time grid, IRTP = pijf – pija The other metric is the Potential Source Contribution Function (PSCF) proposed by Hopke et al., which is the ratio of the filtered and unfiltered residence time probabilities, PSCF = pijf / pija Implementing superposition of multiple GIS map layers The Visibility Information Exchange Web System, VIEWS is an online exchange of visibility data, research, and ideas to support the Regional Haze Rule. The VIEWS system also provides spatio-temporal summaries of key haze parameters. The DataFed data browser has a flexible mapping module that can be incorporated into the VIEWS delivery system. For the past year, B. Schichtel of CIRA/VIEWS and R. Husar/CAPITA have been planning the mapping module transfer but the resources were not available. The CATT-VIEWS extensions enhance the current image-based VIEWS spatial data delivery system by a dynamic mapping module for flexible presentation of spatial data. For example, DataFed trajectory rendering for specific locations and dates can be delivered to VIEWS as a dynamic image, suitable for incorporation into the VIEWS query/presentations system. Figure 8. Trajectory data layer provided to VIEWS through standard web-based GIS (OGC compliant) query The DataFed distributed environmental data browser facilitates access, overlay and rendering of spatial data from multiplicity of web sources. Distributed DataFed was developed at CAPITA with funding from NSF, NASA and EPA. Using distributed browser, the spatial images are 10 generated at use time. Dynamic mapping also allows GIS data layers to be navigated (zoom, pan, point) by the user. Figure 7 illustrates the superposition of VIEWS and other data using the dynamic mapping facility. Figure 9. Illustration of dynamic mapping using VIEWS data. Maintenance of the CATT web server for one year. As part of this project, the functionality of the CATT was transferred to a dedicated server located in the Washing University School of Engineering Computing Center. The CATT server is part of the DataFed server cluster composed of 4 advanced multi-processor DELL servers. These servers are being maintained professionally, 24/7 by the Engineering School. The Data Content of the new CATT server is maintained by periodic updates of the respective databases (CIRA) and software (CAPITA). The updates are initiated manually, since they occur only several times a year. The above described tools for data analysis need to be accessible from standard web browsers. This means that the tools will have to reside on an appropriately reconfigured web server. The extension of CATT consists of three components: a) Include all chemical species that are measured or calculated from the IMPROVE monitoring sites; b) Incorporate all IMPROVE sites for the CATT analysis; c) Perform “on-the-fly” trajectory aggregation. 11 The benefit of a) is that it will allow residence time analysis for individual chemical species, e.g. potassium or nitrate. Extension b) will facilitate exploration of transport to IMPROVE sites anywhere in conterminous US. C. CATT Instruction Manual The CATT manual is contained in a separate document Combined Aerosol Trajectory Tool, CATT Illustrated Instruction Manual http://capita.wustl.edu/capita/capitareports/0411CATTReport/Tutorial/CATT_Manual.doc 12


