jcb_24244_sm_SupplFigs
advertisement
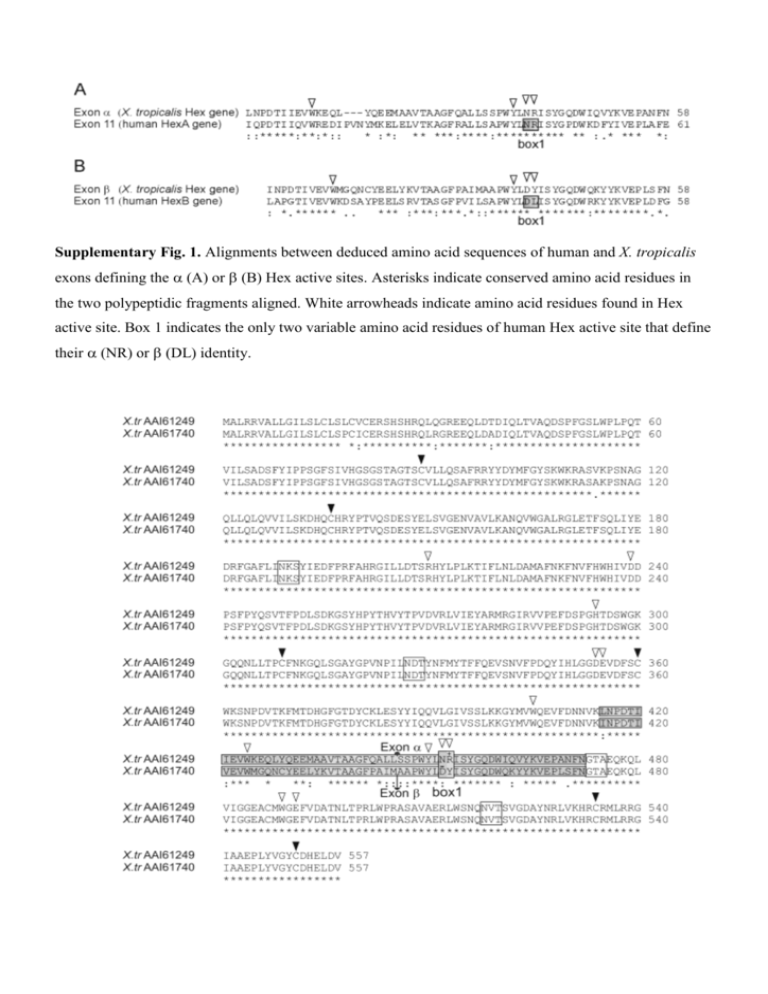
Supplementary Fig. 1. Alignments between deduced amino acid sequences of human and X. tropicalis exons defining the (A) or (B) Hex active sites. Asterisks indicate conserved amino acid residues in the two polypeptidic fragments aligned. White arrowheads indicate amino acid residues found in Hex active site. Box 1 indicates the only two variable amino acid residues of human Hex active site that define their (NR) or DL identity. Supplementary Fig. 2. Alignment of the Hex proteins codified by X. tropicalis (X.tr) mRNAs BC161249 (GenBank ID: AAI61249) and BC161740 (GenBank ID: AAI61740). Asterisks indicate conserved amino acid residues in the aligned sequences. White arrowheads indicate the amino acid residues of Hex active site. Box 1 indicates amino acid residues of Hex active site that defines the -like (NR) or -likeDYX. tropicalis Hex active site. The shaded sequences indicate the polypeptidic fragment codified in the exons designed (in AAI61249 protein) and (in AAI61740 protein) in the X. tropicalis Hex gene. Black arrowheads indicate Cysteine residues predicted to be involved in disulfide bonds. Open boxes indicate putative N-glycosylation sites. Supplementary Fig. 3. Alignments of genomic sequences of (A) and (B) exons of X. tropicalis Hex gene and corresponding sequences in the full ORF cDNAs BC161249 and BC161740. Asterisks indicate conserved nucleotides between aligned sequences. In each case, the deduced amino acid sequences are shown above. Amino acids defining the (A) or (B) Xenopus Hex active site are shown in bold. Supplementary Fig. 4. (A) Alignment between X. tropicalis (X.tr) AAI61249 Hex (mRNA GenBank ID: BC161249) and X. laevis (X.l) GenBank ID: AEJ87970 Hex proteins. (B) Alignment between X. tropicalis AAI61740 Hex (mRNA GenBank ID: BC161740) and X. laevis GenBank ID: AAI59343 Hex proteins. Asterisks indicate conserved amino acid residues in the aligned sequences. White arrowheads indicate amino acid residues of the Hex active site. Box1 indicates amino acid residues defining the like (A) or -like (B) Xenopus Hex active sites. Black arrowheads indicate Cysteine residues predicted to be involved in disulfide bonds. Open boxes indicate putatives N-glycosylation sites. Supplementary Fig. 5. Expression of N-terminal fragment of X. laevis Hex. (A) Aliquots of E. coli pGEX-Hex cultures in the absence (-IPTG) or presence (+IPTG) of IPTG were taken at different times (0; 0.5 and 1.5 hours) and analyzed by 12% SDS-PAGE. (B) Total cell extracts were analyzed at 0, 0.5, 1, 1.5, 2, 3 and 4 hr after addition of 0.1 mM IPTG. (C) Recombinant fusion protein (GST/Hex) was purified from the soluble fraction of cellular lysate after 1.5 hours of induction at 25°C using a Glutathione Sepharose resin. The retained proteins were eluted with reduced Glutathione. Arrowheads indicate the position of GST/Hex protein. Gels were stained with Coomassie brilliant blue. Supplementary Fig. 6. Titter of anti-X. laevis-Hex antiserum. 100 ng and 350 ng of purified GST/Hex protein were run in 10% SDS-PAGE and transferred to nitrocellulose membrane. Immunoblots were performed using different dilutions (from 1/5,000 to 1/20,000) of second and third bleed anti-X. laevisHex antisera. Supplementary Fig.7. Immunohistochemical localization of Hex in X. laevis oviposited and recently fertilized eggs. Micrographs of X. laevis oviposited (A-C) and recently fertilized (zygote; D-I) eggs sections incubated with anti-X. laevis-Hex antiserum. Arrowheads in micrographs B, E and I show the preferential localization of Hex in the animal cortex of eggs (E) and zygotes (E and I) (red fluorescence). C and F are micrographs of the non-cortical cytoplasm of an egg and a zygote respectively. Arrows indicate the small vesicles that generate the immunoreactive Hex signal. H shows a magnification of the zone indicated in inset H´, corresponding to the animal hemisphere of zygote shown in G. (J-O) Control micrographs of oviposited (J-L) and recently fertilized (M-O) eggs treated with normal and anti-GST antisera together. L and O show control micrographs of non-cortical cytoplasm of an egg and a zygote respectively. B, E, I, K and N correspond to the fluorescence micrographs of A, D, H, J and M fields respectively.
![%SYS-3-OVERRUN : Block overrun at [hex] (red zone [hex])](http://s3.studylib.net/store/data/007301636_1-ac70f3209bae6dd18e3a1bf696206cf5-300x300.png)

