Delfini Pearls
Assessing Results: Point Estimates, P-Values, Power & Confidence Intervals
Healthcare Information & Decision Equation: InformationDecision ActionOutcome
Is it trueIs it useful Is it usable?
Meaningful Clinical Benefit is a combination of—
Clinically significant areas (morbidity, mortality, symptom relief, emotional/physical functioning and health-related
quality of life) +
Effect size which means the difference in the size of outcomes between groups reported as measures of outcomes.
Measures of Outcomes measure the event outcome differences in the groups and should always be associated with the
study time period. Most of these are measures of probability that an event will occur. Synonyms for expressing effect size:
estimates of effect, point estimates.
Risk With and Without Treatment is the number or percent of outcomes in each group (if number = 2 x 2 table data)
Absolute Risk Reduction (ARR) is the percentage difference in outcomes between groups.
Number-needed-to-Treat (NNT) is the reciprocal of the ARR and expresses the number of people needed to treat for 1
person to benefit over the comparator.
Relative Risk Reduction (RRR) is the relative percentage difference in size between outcomes.
Relative Risk (RR), also known as Risk Ratio or Relative Risk Ratio, is the probability of the risk in the intervention group
to the probability in the control group. Example: Probability of drawing an ace = 4/52.
Odds ratios (OR) express the odds of an event occurring compared to not occurring and, therefore, cannot be as specific
as probability measures. Example: Odds of drawing an ace = 4/48. Odds and RR are usually similar if the event rate is
low, but compare both the odds ratio reduction and the RRR to check and see if the difference is clinically meaningful.
Many of these measures can be used to express harms (e.g., Absolute Risk Increase or ARI, Number-needed-to-harm or
NNH, etc.), prevention, screening, etc.
P-values: Assuming there truly is no difference between the groups studied, the P-value is a calculated probability of
observing a difference as big as or bigger than the one you observed in a study based on compatibility with an assumed
standard distribution. Problems include the P-value cannot tell you the chance the results are true or even how likely they
are to be due to chance, you do not know if the null hypothesis is true or not, and you do not know if the sample is truly
random and/or representative of the population.
Non-significant results in a valid study arise either because it is true there is no difference between groups, it is a
chance effect or there were insufficient people studied for the outcome to happen (e.g., the study was not sufficiently
“powered”).
Trials stopped early present a high risk of outcomes due to chance even if stopping rules are applied.
Multiple outcomes and multiple analyses points increase the likelihood of chance effects as high as x the number.
A priori should also be research questions, populations for analysis and outcomes for measurement to reduce risk of
chance effects
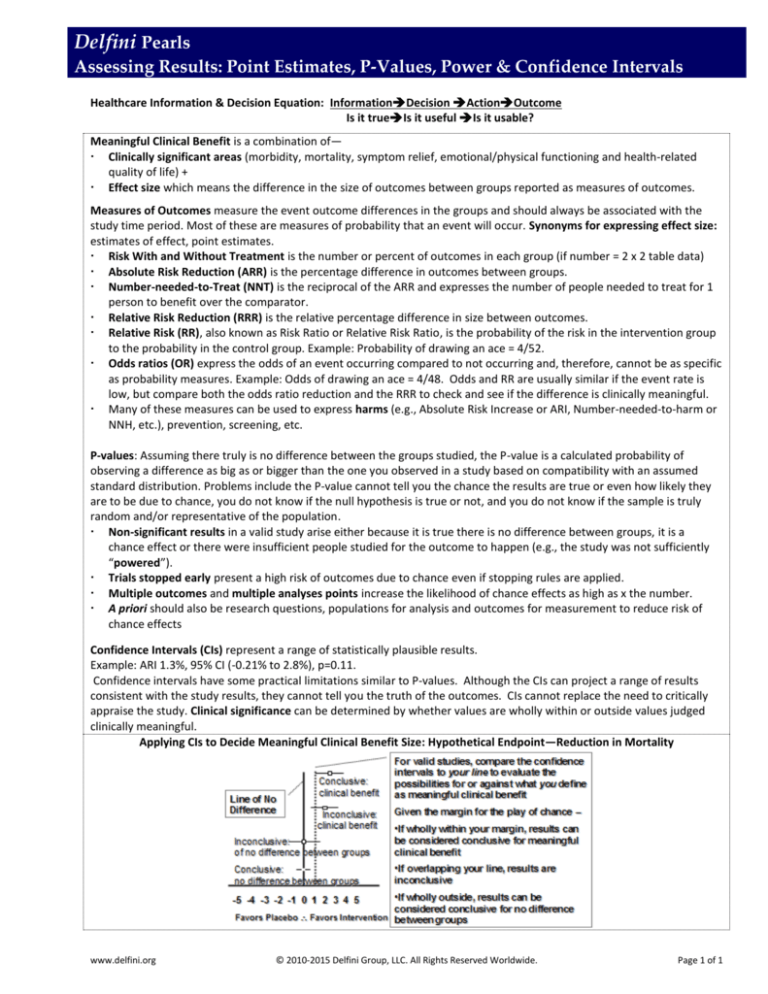
Confidence Intervals (CIs) represent a range of statistically plausible results.
Example: ARI 1.3%, 95% CI (-0.21% to 2.8%), p=0.11.
Confidence intervals have some practical limitations similar to P-values. Although the CIs can project a range of results
consistent with the study results, they cannot tell you the truth of the outcomes. CIs cannot replace the need to critically
appraise the study. Clinical significance can be determined by whether values are wholly within or outside values judged
clinically meaningful.
Applying CIs to Decide Meaningful Clinical Benefit Size: Hypothetical Endpoint—Reduction in Mortality
www.delfini.org
© 2010-2015 Delfini Group, LLC. All Rights Reserved Worldwide.
Page 1 of 1


